KCE Process Book
INTRODUCTION
About Good Clinical Practice (GCP)
Analysis of clinical practices and development of recommendations of good practice Good Practice recommendations include the most up-to-date medical knowledge. They provide a tool for physicians during diagnosis and treatment.
They are drawn up according to highly codified principles, based on scientific information regularly updated from the international literature. KCE analyses clinical practices in current use on the basis of existing recommendations. Recommendations must be regularly adapted in the light of constantly changing evidence.
The KCE generally works with Belgian and international scientific associations for these studies.
About Health Services research (HSR)
In this field of research, the KCE tries to answer the following questions:
- What is the best way to organise and finance healthcare in Belgium?
- How do we keep healthcare accessible and affordable?
- Does everyone have equal access to healthcare?
- What are the objectives of our healthcare system? Are these objectives achieved?
HSR projects cover various scientific disciplines: medicine, economics, sociology, biostatistics, psychology. They require a wide range of investigation strategies, executed by a multidisciplinary research team.
Through HSR, the KCE hopes to hand elements based upon scientifically research that can be used to optimise the management and organisation of the healthcare sector in Belgium. Healthcare must be of the highest quality and be accessible to the largest number of people at an affordable price.
About Health Technology Assessment (HTA)
The market is flooded with generally expensive technologies, treatments and drugs that are often presented as innovative and promising. The aim of the HTA studies is to assess the effectiveness and the safety of these technologies, treatments and drugs. The researchers also attempt to measure the cost effectiveness of the treatments or technologies studied: is the health benefit in proportion to the cost? Does the technology or treatment offer an affordable added value?
KCE made HTA projects one of the foundations of the KCE’s mission. Not because they are a means of justifying savings in the health sector, or as a barrier to the introduction of new technologies, but because they can be used to support the public authorities in their desire to offer added value to patients and to use the available resources as efficiently as possible.
Innovation does not necessarily mean higher healthcare costs. Innovation means offering better and less expensive products. Through its HTA studies, the KCE contributes to optimal allocation of the limited resources available.
METHODOLOGICAL APPROACHES
SEARCH FOR EVIDENCE (GCP - HTA)
This chapter describes the methods of a literature review for the KCE. It provides guidance for reviewers on the various steps of the search, appraisal and presentation of the results.
New evidence may change some of the recommendations made, thereby researchers should consider this as a ‘living document’ for which yearly updates will be required.
This document is mainly based on the following sources of information:
- KCE Process Documents and Notes (KCE and Deloitte, 2003)
- The Cochrane Collaboration Handbook (Higgins and Green, 2011)
- SIGN 50 (SIGN, 2008)
- CRD’s guidance for undertaking reviews in health care (Centre for Reviews and Dissemination (CRD), 2009)
- The QUOROM statement (Moher et al., 1999)
- GRADE (Grade org)
- The KCE Process Notes GCP (Van den Bruel et al., 2007), HSR (Van de Voorde and Léonard, 2007), HTA (Cleemput et al., 2007).
An evidence report consists of the following steps:
1. Introduction
A protocol for carrying out a review is equivalent to, and as important as, a protocol for a primary research study. A review is less likely to be biased if the questions are well developed beforehand, and the methods that will be used to answer them are decided on before gathering the necessary data and drawing inferences. In the absence of a protocol, it is possible that study selection and analysis will be unduly driven by (a presumption of) the findings.
A search strategy consists of several aspects. The research question (in a structured format, see Building a search question) should be used as a guide to direct the search strategy. For electronic searches, it is important to list the databases in which studies will be sought. Other sources can be consulted in order to identify all relevant studies. These include reference lists from relevant primary and review articles, journals, grey literature and conference proceedings, research registers, researchers and manufacturers, and the internet.
In practice, it is uncommon for a single search to cover all the questions being addressed within a review. Different questions may be best answered by different databases, or may rely on different study types. Authors are encouraged to take an iterative approach to the search, carrying out a search for high-level evidence first. After evaluating the results of this first search, the questions may need to be redefined and subsequent searches may need to be focused on more appropriate sources and study types.
In some cases, directly relevant good-quality evidence syntheses (secondary sources), such as good-quality systematic reviews or Health Technology Assessments (HTA), will be available on some of the issues that fall within the remit of the review. In these circumstances reference will be made to the existing evidence rather than repeating work that already has been done. All HTA reports or systematic reviews that are identified must be evaluated on their quality and must be shown to have followed an acceptable methodology before they can be considered for use in this way.
In other cases existing evidence may not be directly relevant or may be found to have methodological weaknesses. In these cases, existing evidence cannot be used in the review. Nevertheless, excluded systematic reviews or HTA reports still can be a useful source of references that might be used later on in the review.
In conclusion, literature searches for the KCE should follow an iterative approach, searching for evidence syntheses first and subsequently complementing this search by searching for original studies. Various resources are listed in the following paragraph.
2. Building a search question
Constructing an effective combination of search terms for searching electronic databases requires a structured approach. One approach involves breaking down the review question into ‘facets’. Several generic templates exist, e.g. PICOS (Population, Intervention, Comparator, Outcome and Study design), PIRT (Population, Index test, Reference test, Target disorder), SPICE, ECLIPSE, SPIDER, etc. (See Appendices).
The next stage is to identify the search terms in each ‘facet’ which best capture the subject. The group of search terms covering each facet of the review question should include a range of text words (free text to be searched in the title or abstract of studies). Text words and their variants can be identified by reading relevant reviews and primary studies identified during earlier searches or a pre-assessment of the literature. Information on the subject indexing used by databases can be found by consulting the relevant indexing manuals and by noting the manner in which key retrieved articles have been indexed by a given database.
The final search strategy will be developed by an iterative process in which groups of terms are used, perhaps in several permutations, to identify the combination of terms that seems most sensitive in identifying relevant studies. This requires skilled adaptation of search strategies based on knowledge of the subject area, the subject headings and the combination of ‘facets’ which best capture the topic.
3. Searching electronic sources
The decision on which source to use depends on the research question. The three electronic bibliographic databases generally considered being the richest sources of primary studies - MEDLINE, EMBASE, and CENTRAL - are essential in any literature review for the KCE. However, many other electronic bibliographic databases exist.
Systematic reviews can be found in the Cochrane Database for Systematic Reviews, in DARE or in Medline. Search strategies have been developed to enhance the identification of these types of publications (Kastner, 2009; Montori, 2005).
HTA reports can be found in the HTA database of INAHTA or at individual agencies’ sites (see HTAi vortal under "HTA Agencies and Networks").
Specifically for drugs and technology reviews, data from the US Federal Drug Administration (FDA) or EMA can be helpful.
Providing an exhaustive list of all potential sources is not possible here. The KCE library catalogue provides a list of such sources.
Access to electronic resources happens through the following digital libraries:
![]() More than 10.000 e-journals and 8700 Ebooks (IP recognition)
More than 10.000 e-journals and 8700 Ebooks (IP recognition)
 Access to databases, journals and eBooks via CEBAM DLH (login required)
3.1 Sources of biomedical literature
Core databases
- MEDLINE contains records from 5600 journals (39 languages) in the of biomedical field, from 1946 onwards (Access for KCE | Free access through PubMed).
- EMBASE: Records from 7600 journals (70 countries, 2000 not covered by Medline) in biomedical field, from 1974 onwards (Access for KCE).
- CENTRAL - The Cochrane Controlled Trials Register, part of the Cochrane Library: Records of randomised controlled trials and controlled clinical trials in healthcare identified through the work of the Cochrane Collaboration including large numbers of records from MEDLINE and EMBASE as well as much material not covered by these databases (Dickersin, 2002). (Access for KCE through CDLH | Free access to abstracts)
Databases for systematic reviews
- CRD Database of reviews of effectiveness (DARE) contains structured abstracts, including critical appraisal, of systematic reviews identified by regular searching of bibliographic databases, and handsearching of key journals. [the update of CRD DARE has ceased March 2015]
- Cochrane Database of Systematic Reviews (CDSR, part of the Cochrane Library) lists the results of systematic reviews (full text) conducted by Cochrane groups, but also ongoing projects (Access for KCE through CDLH | Free access to abstracts)
- Special queries exist for Medline or Embase to limit the identified records to articles identified as Systematic reviews. See appendix.
Databases for HTA reports
- The INAHTA HTA database is a bibliographical database of published HTA reports; it also lists ongoing HTA projects. Members of INAHTA are regularly invited to update their information on the HTA database, informaiton from the main HTA producers is also collected by the database maintainer. Access is free, records of the HTA database are also searchable via the Cochrane Library.
- HTA reports can also be found at individual agencies’ sites, the HTAi vortal lists HTA organisations, it also provides a custom Web search engine that limits the Google results to pages published on the website of HTA organisations listed on the HTAi vortal.
Databases for specific topics
- Nursing: CINAHL (Cumulative Index to Nursing and Allied Health Literature), British Nursing Index (BNI) (Access for KCE through CDLH)
- Physiotherapy: PEDro (contains records of RCTs, systematic reviews and evidence-based clinical practice guidelines in physiotherapy, from 1929 onwards; most trials in the database have been rated for quality to quickly discriminate between trials that are likely to be valid and interpretable and those that are not; free access)
- Psychology and Psychiatry: PsycInfo (Access for KCE)
- More bibliographic databases are listed on the KCE library catalogue (e.g. CAM, ageing, ...)
3.2 Sources of economic literature
Core database
- NHS Economic Evaluation Database (NHS EED) contains over 7000 abstracts of quality assessed economic evaluations. The database aims to assist decision-makers by systematically identifying and describing economic evaluations, appraising their quality and highlighting their relative strengths and weaknesses. [the update of CRD NHS EED has ceased March 2015]
- Some of the search filters for Medline or Embase limit the records to articles related to Costs, Economic evaluations, Economics
Complementary databases
- EconLit:database of economics publications including peer-reviewed journal articles, working papers from leading universities, PhD dissertations, books, collective volume articles, conference proceedings, and book reviews (Access for KCE)
3.3 Sources of clinical practice guidelines
Often, specific guidelines can only be retrieved through local websites of scientific associations or government agencies. It is therefore recommended to combine a Medline search (with specific filters for guidelines) with a search of the following:
- National Guideline Clearinghouse (NGC): a US-based database of clinical practice guidelines primarily in the English language; free access
- International Guideline Library (G-I-N): database of the Guideline International Network (KCE is member of GIN and has full access to the records)
- EBMpracticenet: DUODECIM guidelines, free access in Belgium, funded by RIZIV-INAMI, translation in Dutch and French; adaptation to Belgian context ongoing
- More sources of guidelines are available on BIBKCE under Databases, Practice Guidelines or Practice Guideline, Publishers' catalogue
3.4 Sources of ongoing clinical trials
Ongoing trials may have limited use as a means of identifying studies relevant to systematic reviews, but may be important so that when a review is later updated, these studies can be assessed for possible inclusion. Several initiatives have been taken recently to register ongoing trials:
- International Clinical Trials Registry Platform (ICTRP)
- EU Clinical Trials Register
- ClinicalTrials.gov
- Current Controlled Trials
- More clinical trials register are listed on the KCE library catalogue
3.5. Sources of grey literature
More and more electronic sources describe "grey literature" (results of scientific research not published in scientific journals; e.g. reports, working papers, thesis, conference papers, ...)
Institutional repositories
- OAIster
- Base
- OpenAIRE
- EconPapers (REPEC)
- More repositories are listed on the KCE library catalogue
3.6 Building a search strategy
For each database, search terms defined in the preparation phase will be mapped to the Thesaurus terms of the database (when available). Mapping can be achieved using the built-in functionality of the search interface, or manually by looking at the indexation of previously identified pertinent articles. Attention will need to be paid to the explosion tool (sometimes selected by default linke in PubMed, sometimes not like in OVID Medline).
The most important synonyms of the Thesaurus terms identified for each facet will also be added to the search strategy as text word. Advanced functionalities of the search interfaces will be used (see below: truncation, wildcard, proximity operators).
The terms within a specific facet will be combined with the Boolean operator ‘OR’ in order to group all articles dealing with this facet. For some concepts, special queries (also called search filters) have been developed (see below). The resulting groups of articles will then be combined using the Boolean operator ‘AND’.
It is recommended to validate each search strategy by a second reviewer.
3.6.1 Search tools
Boolean and proximity operators
In the context of database searching, Boolean logic refers to the logical relationships among search terms. Classical Boolean operators are ‘AND’, ‘OR’ and ‘NOT’, which can be used in most databases. Importantly, in some databases, such as PubMed, these Booleans need to be entered in uppercase letters. Other operators, the so-called proximity operators, are ‘NEAR’, ‘NEXT’ and ‘ADJ’. A more detailed overview of Boolean and proximity operators is provided in Appendix.
Truncation & wildcards
Truncation can be used when all terms that begin with a given text string are to be found. Different databases use different characters for truncation with different functionalities. For example, in PubMed, OVID and EMBASE ‘unlimited’ truncation is represented by the asterix ‘*’, but OVID Medline also uses ‘$’.
In OVID Medline the ‘optional’ wildcard character ‘?’ can be used within or at the end of a search term to substitute for 1 or 0 characters. In contrast, in EMBASE a question mark indicates exactly one character.
A more detailed overview is provided in appendix.
3.6.2 Search limits
When the amount of resulting hits is too high to be managed within the available timeframe / resources, search limits may be applied.
First, tools related to the Thesaurus should be considered:
- Focus / Major Heading: limits to the articles that have been indexed with the term as Major Heading. This helps to reduce the amount of results (up to 40%) while keeping a good pertinence thanks to the human indexation of the full article (in case of Medline and Embase).
- Subheading: these are also added to the description of an article by the indexers, but should be used with more precaution (can render the search strategy too restrictive).
Several search interfaces provide search limits that can also be applied to narrow the search. Classical examples are date and language limits, but some databases also provide limits according to age, gender, publication type etc. Before applying search limits, the risk of a too specific (i.e. narrow) search should be considered.
3.6.3. Search filters
In systematic reviews, if time and resources allow, specificity is often sacrificed in favour of sensitivity, to maximize the yield of relevant articles. Therefore, it is not unusual to retrieve large numbers (possibly thousands) of bibliographic references for consideration for inclusion in an extensive systematic review. This means that reviewers may have to spend a lot of time scanning references to identify perhaps a limited number of relevant studies.
Search filters are available to focus the search according to the type of study that is sought, for example to focus on randomized controlled trials, diagnostic accuracy studies, prognostic studies or systematic reviews (see example in appendix). Specific search filters also exist for well-circumscribed clinical problems/populations, e.g. child health (Boluyt, 2008), palliative care (Sladek, 2007), or nephrology (Garg, 2009).
Sources of filters include:
- PubMed at the Clinical Queries screen
- InterTASC: http://www.york.ac.uk/inst/crd/intertasc/index.htm
- SIGN website: http://www.sign.ac.uk/methodology/filters.html
- HiRU: http://hiru.mcmaster.ca/hiru/
- OVID or Embase.com
During the selection of an appropriate search filter, aspects of testing and validation should play an important role. Specific appraisal tools are available to evaluate the methodological quality of search filters (Bak, 2009; Glanville, 2009).
For diagnostic studies, it is recommended not to use a search filter.
3.7 Documenting a search strategy
The search strategy for electronic databases should be described in sufficient detail to allow that
- the process could be replicated
- an explanation could be provided regarding any study not included in the final report (identified by electronic sources search or not)
The template required by KCE to describe a search strategy is provided in attachment.
All identified references must be exported, preferably in a text file to be imported in a Reference Management Software (see appendix for technical description).
| Attachment | Size |
|---|---|
| process_04_template_-_search_strategy_1.doc | 38 KB |
| process_04_template_-_search_strategy_1.odt | 10.76 KB |
4. Searching supplementary sources
Checking references lists
- Authors should check the reference lists of articles obtained (including those from previously published systematic reviews) to identify relevant reports. The process of following up references from one article to another is generally an efficient means of identifying studies for possible inclusion in a review.
- Because investigators may selectively cite studies with positive results (Gotzsche 1987; Ravnskov 1992), reference lists should never be used as a sole approach to identifying reports for a review, but rather as an adjunct to other approaches.
Using related citation tools
- Several electronic sources provide a "Find related" functionality. This functionality is often based on a poorly detailed (and thus difficult to describe and reproduce) algorithm (using theseaurus terms, keywords, ...). Therefore, we recommend to list the identified supplemental references under "Related citations".
- Several electronic sources provide a "find citing articles" functionality. This functionality is often related to the quality of the references provided by the authors and thus not always exact. Therefore, we recommend to list the identified supplemental references under "Citing articles".
Other supplementary sources
- Websites
- Handsearching of journals
- Experts in the field
- Etc.
5. Searching for evidence on adverse effects
The first sources to investigate for information on adverse effects are reports from trials or other studies included in the systematic review. Excluded reports might also provide some useful information.
There are a number of specific sources of information on adverse effects of drugs, including:
- Europe: European Medicines Agency, www.ema.europa.eu
- US: Food and Drug Administration, www.fda.gov/medwatch
- UK: Medicines and Healthcare Products Regulatory Agency, www.mhra.gov.uk
- Australia: Australian Adverse Drug Reactions Bulletin, www.tga.gov.au/adr/aadrb.htm
- The Netherlands: Landelijke Registratie en Evaluatie van Bijwerkingen, www.lareb.nl
In Belgium, there is currently no public database on adverse drug events. Regulatory authorities (such as the websites of FDA and EMA) and the drug manufacturer may be able to provide some information. Information on adverse effects should also be sought from other types of studies than those considered appropriate for the systematic review (e.g. cohort and case-control studies, uncontrolled [phase I and II] trials, case series and case reports). However, all such studies and reports are subject to bias to a greater extent than randomized trials, and findings must be interpreted with caution.
6. Selecting studies
Study selection is a multi-stage process. The process by which studies will be selected for inclusion in a review should be described in the review protocol.
6.1. Inclusion and exclusion criteria
The final inclusion/exclusion decisions should be made after retrieving the full texts of all potentially relevant citations. Reviewers should assess the information contained in these reports to see whether the criteria have been met or not. Many of the citations initially included may be excluded at this stage.
The criteria used to select studies for inclusion in the review must be clearly stated:
6.1.1. Types of participants
The diseases or conditions of interest should be described here, including any restrictions on diagnoses, age groups and settings. Subgroup analyses should not be listed here.
6.1.2. Type of interventions
Experimental and control interventions should be defined here, making it clear which comparisons are of interest. Restrictions on dose, frequency, intensity or duration should be stated. Subgroup analyses should not be listed here.
6.1.3. Types of outcome measures
Note that outcome measures do not always form part of the criteria for including studies in a review. If they do not, then this should be made clear. Outcome measures of interest should be listed in this section whether or not they form part of the inclusion criteria.
For most reviews it will be worthwhile to pilot test the inclusion criteria on a sample of articles (say ten to twelve papers, including ones that are thought to be definitely eligible, definitely not eligible and questionable). The pilot test can be used to refine and clarify the inclusion criteria, train the people who will be applying them and ensure that the criteria can be applied consistently by more than one person.
Even when explicit inclusion criteria have been specified, decisions concerning the inclusion of individual studies remain relatively subjective. There is evidence that using at least two authors has an important effect on reducing the possibility that relevant reports will be discarded (Edwards et al. 2002). Agreement between assessors may be formally assessed mathematically using Cohen's Kappa (a measure of chance-corrected agreement). Many disagreements may be simple oversights, whilst others may be matters of interpretation. These disagreements should be discussed, and where possible resolved by consensus after referring to the protocol. If disagreement is due to lack of information, the authors may have to be contacted for clarification. Any disagreements and their resolution should be recorded.
The influence of uncertainty about study selection may be investigated in a sensitivity analysis.
It is useful to construct a list of excluded studies at this point, detailing the reason for each exclusion. This list may be included in the report of the review as an appendix. The final report of the review should also include a flow chart or a table detailing the studies included and excluded from the review. In appendix a flow chart is provided for documenting study selection. If resources and time allow, the lists of included and excluded studies may be discussed with the expert panel. It may be useful to have a mixture of subject experts and methodological experts assessing inclusion.
6.1.4. Types of studies
Eligible study designs should be stated here, along with any thresholds for inclusion based on the conduct or quality of the studies. For example, ‘All randomised controlled comparisons’ or ‘All randomised controlled trials with blind assessment of outcome’. Exclusion of particular types of randomised studies (for example, cross-over trials) should be justified.
It is generally for authors to decide which study design(s) to include in their review. Some reviews are more restrictive, and include only randomized trials, while others are less restrictive, and include other study designs as well, particularly when few randomized trials addressing the topic of the review are identified. For example, many of the reviews from the Cochrane Effective Practice and Organization of Care (EPOC) Collaborative Review Group include before-and-after studies and interrupted time series in addition to randomized and quasi-randomized trials.
6.2. Selection process
Before any papers are acquired for evaluation, sifting of the search output is carried out to eliminate irrelevant material.
- Papers that are clearly not relevant to the key questions are eliminated based on their title.
- Abstracts of remaining papers are then examined and any that are clearly not appropriate study designs, or that fail to meet specific methodological criteria, will be also eliminated at this stage.
- All reports of studies that are identified as potentially eligible must then be assessed in full text to see whether they meet the inclusion criteria for the review.
The reproducibility of this process should be tested in the initial stages of the review, and if reproducibility is shown to be poor more explicit criteria may have to be developed to improve it.
Authors must decide whether more than one author will assess the relevance of each report. Whatever the case, the number of people assessing the relevance of each report should be stated in the Methods section of the review. Some authors may decide that assessments of relevance should be made by people who are blind or masked to the journal from which the article comes, the authors, the institution, and the magnitude and direction of the results by editing copies of the articles (Berlin 1997; Berlin, Miles, and Crigliano 1997). However, this takes much time, and may not be warranted given the resources required and the uncertain benefit in terms of protecting against bias (Berlin 1997).
| Attachment | Size |
|---|---|
| Process_06_Template_StudiesSelection_20200716.xls | 314 KB |
7. Quality assessment of studies
Critical appraisal of articles is a crucial part of a literature search. It aims at identifying methodological weaknesses and assessing the quality in a coherent way. The methodological assessment is based on a number of key questions that focus on those aspects of the study design that have a significant influence on the validity of the results reported and conclusions drawn. These key questions differ according to the study type, and a range of checklists can be used to bring a degree of consistency to the assessment process. The checklists for systematic reviews, randomized controlled trials, cohort studies and case-control studies discussed below were selected during several internal workshops at the KCE. The other checklists (for diagnosis studies for instance) will also be discussed.
The process of critical appraisal consists of an evaluation by two independent reviewers who confront their results and discuss them with a third reviewer in case of disagreement. However, because of feasibility it could be acceptable that one reviewer does the quality appraisal and that a second reviewer checks the other’s work.
If necessary, the authors of the evaluated study should be contacted for additional information.
The results of the critical appraisal should be reported in a transparent way.
7.1. Critical appraisal of systematic reviews
From the several instruments available to assess methodological quality of reviews (1); KCE recommends the use of AMSTAR 2 (2) that takes into account RCT but also non RCT studies.
An alternative is the ROBINS-tool which is more comprehensive for non randomized studies. (3)
References
(1) See among other overviews
- Zeng X, Zhang Y, Kwong JSW, Zhang C, Li S, Sun F, et al. The methodological quality assessment tools for preclinical and clinical studies, systematic review and meta-analysis, and clinical practice guideline: a systematic review. Journal of Evidence-Based Medicine. 2015;8(1):2-10.
- Pieper D, Antoine S-L, Morfeld J-C, Mathes T, Eikermann M. Methodological approaches in conducting overviews: current state in HTA agencies. Research Synthesis Methods. 2014;5(3):187-99
(2) Shea Beverley J, Reeves Barnaby C, Wells George, Thuku Micere, Hamel Candyce, Moran Julian et al. AMSTAR 2: a critical appraisal tool for systematic reviews that include randomised or non-randomised studies of healthcare interventions, or both BMJ 2017; 358 :j4008
Updates
[Update 20180126] AMSTAR 2 replaces AMSTAR in the toolbox
AMSTAR 2 aims at responding to AMSTAR's criticisms, among others the fact that AMSTAR does not cover non RCT studies.
- Shea BJ, Grimshaw JM, Wells GA, Boers M, Andersson N, Hamel C, et al. Development of AMSTAR: a measurement tool to assess the methodological quality of systematic reviews. BMC Med Res Methodol. 2007;7:10
- Burda BU, Holmer HK, Norris SL. Limitations of A Measurement Tool to Assess Systematic Reviews (AMSTAR) and suggestions for improvement. Syst Rev. 2016;5(1):58.
[Update] Dutch Cochrane checklist removed from the toolbox
KCE experts initially selected 2 checklists for quality appraisal: AMSTAR and the Dutch Cochrane checklist. However, the Dutch Cochrane tool is not used anymore by its authors and was never formally validated. It has thus been removed from the toolbox.
| Attachment | Size |
|---|---|
| KCEProcessbook_Amstar2-checklist.docx | 47.91 KB |
7.2. Critical appraisal of randomized controlled trials for interventions
For the quality appraisal of randomized controlled trials for interventions, the Cochrane Collaboration’s Risk of Bias Tool is recommended [1]. This checklist contains hints on how to interpret and score the individual items, and is summarised in the attachement "Cochrane Collaboration's Risk of Bias Tool". It is also extensively explained in chapter 8 of the Cochrane Handbook (http://www.cochrane-handbook.org/). Each item can be scored with low, unclear or high risk of bias. Importantly, performance bias (blinding) and attrition bias (incomplete outcome data) should be assessed for each critical and important outcome as selected according to GRADE. If insufficient detail is reported of what happened in the study, the judgement will usually be unclear risk of bias.
The recommended level at which to summarize the risk of bias in a study is for an outcome within a study, because some risks of bias may be different for different outcomes. A summary assessment of the risk of bias for an outcome should include all of the entries relevant to that outcome: i.e. both study-level entries, such as allocation sequence concealment, and outcome specific entries, such as blinding.
Some methodological issues, such as the correctness of the statistical analysis, power, etc. are not specifically addressed in this tool, and should be assessed separately.
The scores can be filled in using the template in attachment.
[1] KCE experts initially selected 2 checklists for quality appraisal: the Risk of Bias Tool and the Dutch Cochrane checklist. However, the Dutch Cochrane tool is not used anymore by its authors and was never formally validated.
| Attachment | Size |
|---|---|
| Cochrane Collaboration's Risk of Bias Tool.doc | 74.5 KB |
| Template Risk of Bias tool.doc | 41.5 KB |
7.3. Critical appraisal of diagnostic accuracy studies
For the quality appraisal of diagnostic accuracy studies, the QUADAS 2 instrument is recommended (Whiting, 2003). The tool is structured so that 4 key domains are each rated in terms of the risk of bias and the concern regarding applicability to the research question. Each key domain has a set of signalling questions to help reach the judgments regarding bias and applicability. A background document on QUADAS 2 can be found on the website: http://www.bris.ac.uk/quadas/quadas-2.
In order to correctly appraise a diagnostic accuracy study, basic knowledge about key concepts is essential. An overview of these concepts is provided in the following table:
Three phases can be distinguished in the QUADAS tool:
- Phase 1: State the review question using the PIRT format (Patients, Index test(s), Reference standard, Target condition)
- Phase 2: Draw a flow diagram for the primary study, showing the process of recruiting, inclusion, exclusion and verification
- Phase 3: Risk of bias and applicability judgments.
The score can be filled in using the template in attachment.
| Attachment | Size |
|---|---|
| Template QUADAS 2 tool.doc | 59 KB |
7.4. Critical appraisal of observational studies
Unlike systematic reviews, randomized controlled trials, diagnostic studies and guidelines, the methodological research community has less agreement on which items to use for the quality appraisal of cohort studies, case-control studies and other types of observational evidence. The Dutch Cochrane Centre has a few checklists available (http://dcc.cochrane.org/beoordelingsformulieren-en-andere-downloads), but these are written in Dutch and were not formally validated. For the evaluation of prospective, non-randomized, controlled trials, the Cochrane Collaboration’s Risk of Bias Tool can be used. Other checklists can be found at: http://www.unisa.edu.au/Research/Sansom-Institute-for-Health-Research/Research-at-the-Sansom/Research-Concentrations/Allied-Health-Evidence/Resources/CAT/. GRADE also offers a number of criteria that can be used to judge the methodological quality of observational studies. These are further explained in the chapter on GRADE.
Mainly based on the checklists of SIGN and NICE, the KCE elaborated two new checklists for cohort studies and case-control studies (see attachment).
| Attachment | Size |
|---|---|
| Cohort studies_template.docx | 49.9 KB |
| Case-control studies_template.docx | 48.3 KB |
7.5. Critical appraisal of guidelines
For the quality appraisal of clinical practice guidelines, the AGREE II instrument (www.agreetrust.org) is recommended. AGREE II comprises 23 items organized into 6 quality domains: i) scope and purpose; ii) stakeholder involvement; iii) rigour of development; iv) clarity of presentation; v) applicability; and vi) editorial independence. Each of the 23 items targets various aspects of practice guideline quality and can be scored on a scale from 1 (strongly disagree) to 7 (strongly agree). Two global rating items allow an overall assessment of the guideline’s quality. Detailed scoring information is provided in the instrument in attachment.
Ideally, the quality appraisal of a guideline is done by 4 reviewers, but because of feasibility 2 reviewers can be considered acceptable.
AGREE II serves 3 purposes:
1. to assess the quality of guidelines;
2. to provide a methodological strategy for the development of guidelines; and
3. to inform what information and how information ought to be reported in guidelines.
| Attachment | Size |
|---|---|
| AGREEII.pdf | 392.52 KB |
8. Data extraction
Data extraction implies the process of extracting the information from the selected studies that will be ultimately reported. In order to allow an efficient data extraction, the process should be detailed in the protocol before the literature search is started. Key components of the data extraction include:
- information about study reference(s) and author(s);
- verification of study eligibility;
- study characteristics:
- study methods
- participants
- interventions
- outcomes measures and results
Evidence tables
All validated studies identified from the systematic literature review relating to each key search question are summarized into evidence tables. The content of the evidence tables is determined by the entire project group. Completion for all retained articles is done by one member of the project group and checked by another member. A KCE template for evidence tables was developed using the CoCanCPG evidence tables (www.cocancpg.eu/) and the GIN evidence tables (http://g-i-n.net/activities/etwg/progresses-of-the-etwg) as a basis, and can be found in attachment. A template is available for systematic reviews, intervention studies, diagnostic accuracy studies and prognostic studies.
| Attachment | Size |
|---|---|
| evidence tables_final.docx | 66.61 KB |
GRADE evidence profiles
To provide an overview of the body of evidence for each comparison relevant to the research question, GRADE evidence profiles are created and added to the appendix of the report. These evidence profiles can serve as a basis for the content discussions during the expert meetings. To create these evidence profiles it is highly recommended to use the GRADEpro software, which can be downloaded for free (http://ims.cochrane.org/revman/other-resources/gradepro/download).
When a meta-analysis is possible, it is recommended to extract the necessary information to Review Manager (RevMan) first, and subsequently to import this information from RevMan into GRADEpro (using the button ‘Import from RevMan’). More information on the use of RevMan can be found here: http://ims.cochrane.org/revman.
Once all information is extracted in GRADEpro, evidence profiles can be created by clicking the ‘Preview SoF table’ button, selecting the format ‘GRADE evidence profile’ and exporting them to a Word Document.
9. Analysing and interpreting results
Once the eligible studies are selected and quality appraised, the magnitude of the intervention effect should be estimated. The best way to do this is by performing a meta-analysis (i.e. the statistical combination of results from two or more separate studies), although this is not always feasible. An interesting tool for doing a limited meta-analysis is the free Review Manager software of the Cochrane Collaboration.
The starting point of the analysis and interpretation of the study results involves the identification of the data type for the outcome measurements. Five different types of outcome data can be considered:
- dichotomous data: two possible categorical response;
- continuous data
- ordinal data: several ordered categories;
- counts and rates calculated from counting the numbers of events that each individual experiences;
- time-to-event data
Only dichotomous data will be addressed here. Dichotomous outcome data arise when the outcome for every study participant is one of two possibilities, for example, dead or alive. These data can be summarised in a 2x2 table:
| Outcome | |||
| YES | NO | ||
| Intervention | a | b | a + b |
| Control | c | d | c + d |
| a + c | b + d |
The most commonly encountered effect measures used in clinical trials with dichotomous data are:
- Relative risk (RR): the ratio of the risk (i.e. the probability with which the outcome will occur) of the outcome in the two groups, or [a/(a+b)]/[c/(c+d)]. For example, a RR of 3 implies that the outcome with treatment is three times more likely to occur than without treatment;
- Absolute risk reduction (ARR): the absolute difference of the risk of the outcome in the two groups, or [a/(a+b)]-[c/(c+d)];
- Number needed to treat (NNT): the number of persons that need to be treated with the intervention in order to prevent one additional outcome, or 1/ARR.
- For diagnostic accuracy studies, the results will be expressed as
- Sensitivity: the proportion of true positives correctly identified by the test: Sens=a/a+c
- Specificity: the proportion of true negatives correctly identified by the test: Spec=d/b+d
- Positive predictive value: the proportion of patients with a positive test result correctly diagnosed: PPV=a/a+b
- Negative predictive value: the proportion of patients with a negative test result correctly diagnosed: NPV=d/c+d
- Likelihood ratio: likelihood that a given test result would be expected in a patient with the target disorder compared to the likelihood that that same result would be expected in a patient without the target disorder LR+=(a/a+c)/(b/b+d); LR-=(c/a+c)/(d/b+d)
- Diagnostic odds ratio: ratio of the odds of having a positive index test result in a patient with the target condition over the odds of having this test result in a patient without the target condition: OR=ad/bc
| Target condition Positive |
Target condition Negative |
|
| Index test positive | a | b |
| Index test negative | c | d |
As discussed above, other types than dichotomous data are possible, each with their own outcome measures and statistics. It is beyond the scope of this document to describe and discuss all these types. Interested readers are referred to textbooks such as Practical statistics for medical research (Altman 1991) Modern Epidemiology (Rothman and Greenland 1998) and Clinical epidemiology : a basic science for clinical medicine (Sackett 1991) .
10. Reporting of the literature review
A literature search should be reproducible and therefore explicitly documented. The report of a literature search should contain the following items:
1. Description of the search methodology:
a. Search protocol
i. Search question
ii. Searched databases
iii. Search terms, their combinations and the restrictions used (e.g. language, date)
iv. In- and exclusion criteria for the selection of the studies
b. Quality appraisal methodology
c. Data extraction methodology
2. Description of the search results:
a. Number of retrieved articles, in- and excluded studies, and reasons for exclusion; use of flow chart
b. Results of quality appraisal
c. Evidence tables for each search question
LITERATURE REVIEW AND INTERNATIONAL COMPARISON (HSR)
See the attached document
Table of content
- Introduction
- Literature review
- Introduction
- Literature review
- Meta review: reveiw of review
- International comparison
- Rationales for international comparisons in HSR research: does an international comparison serve your problem?
- Adapt the “set-up” of the international comparison to theproblem you want to address
| Attachment | Size |
|---|---|
| 2015-72-(Method)_HSR Process Notes Literature review and international comparison_Report_0.pdf | 430.75 KB |
DATA - COLLECTION AND ANALYSIS
<This chapter will be published in September 2013>
QUALITATIVE DATA (GCP - HSR - HTA)
Although there is no unified definition of qualitative research, most authors agree about its main characteristics. Creswell formulated it like this: “Writers agree that one undertakes qualitative research in a natural setting where the researcher is an instrument of data collection who gathers words or pictures, analyzes them inductively, focuses on the meaning of participants, and describes a process that is expressive and persuasive in language” (Creswell, 1998). The gathering of qualitative data takes many forms, but interviewing and observing are among the most frequently used, no matter the theoretical tradition of the researcher.
1. How to chose a qualitative method?
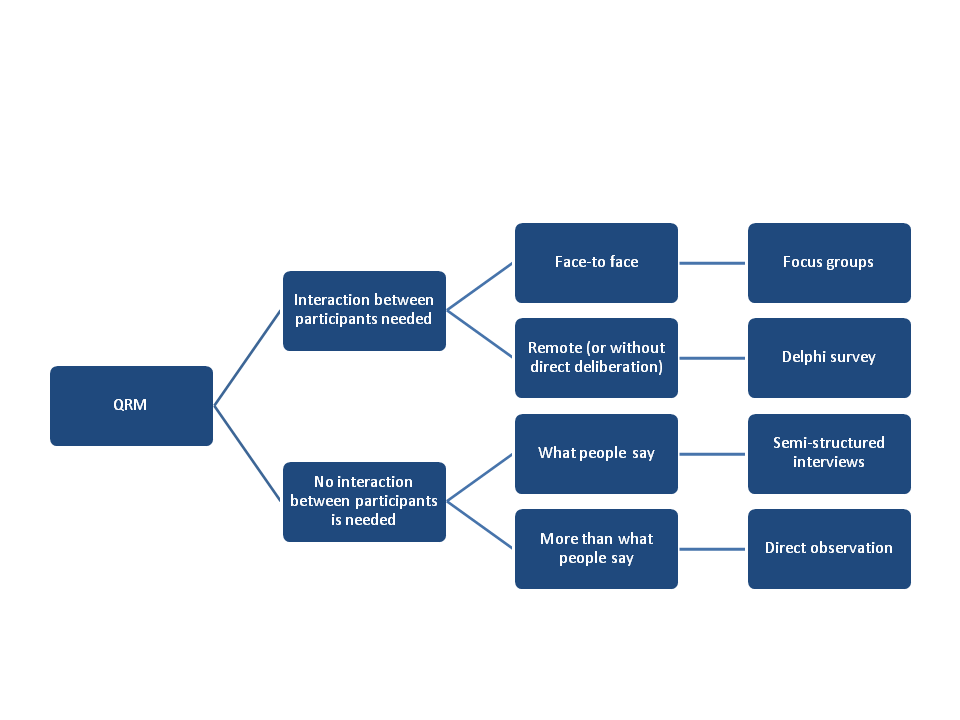
We so far identified 4 types of QRM suitable for the KCE research projects useful to describe in a first report: interviewing (individually or in focus groups), observing and structuring discussions among experts with a Delphi survey. Others should be developed in the future.
Before entering in the practical aspect of each method, we will briefly describe them in order to give some guidance to choose the most appropriate one.
- Semi-structured individual interview aims at searching for data through questioning the respondent using conversational techniques, “…being shaped partly by the interviewer’s pre-existing topic guide and partly by concerns that are emergent in the interview.” (Bloor and Wood, 2006, p. 104). “It gives the opportunity to the respondents to tell their own stories in they own words” (Bowling, 1997, p. 336). The use of such a method in the KCE context is appropriate when the aim is to identify different point of views, beliefs, attitudes, experience of people such patients, practitioners, stakeholders, etc. when no interaction between the respondents is required or appropriate (according to the topic for example). It could also be chosen because of practical reasons, e.g. when participants are not easily ‘displaceable’, or lack time.
- Focus groups is a form of semi-structured interview. It consists on “a series of group discussions held with differently composed groups of individuals and facilitated by a researcher, were the aim is to provide data (via the capture of intra-group interaction) on groups beliefs and group norms in respect of a particular topic or set of issues” (Bloor and Wood, 2006, p. 88). This is useful “where we need interactivity to enhance brainstorming among the participants, gain insights and generate ideas in order to pursue a topic in greater depth” (Bowling, 1997, p 352). Focus groups ‘”worked well and provide the richest data in relation to public’s view of priorities for health services and (…) were less inhibiting for respondent that one-to-one interviews (Bowling, 1997, p. 354).
- Observation is useful to understand more than people say about (complex) situations (Bowling, 1997). In the KCE context, it will be useful for site visits, when preparing a report on a hospital or a health service, a procedure, etc.
- The Delphi survey aims to achieve consensus or define positions among experts panelists, through iterations of anonymous opinions and of proposed compromise statements from the group moderator (Bloor and Wood, 2006). For KCE reports, this method could be useful for setting priorities, clarify acceptability of a new technology or system or innovations.
2. How to set up?
Following the discussions we have heard in the different focus groups, not every KCE researcher expressed the need to use or understand QRM. Nevertheless, for those interested in QRM, we try to respond to the different researchers’ needs through the notes that will be published in the KCE process book.
[1] For further reading: Silverman (2011)
Why opt for a qualitative approach?
“The goal of qualitative research is the development of concepts which help us to understand social phenomena in natural (rather than experimental) settings, giving due emphasis to the meanings, experiences, and views of all the participants” (Mays, 1995,p. 43). This quotation gives a nice summary of the specificities of qualitative research methods, which are discussed below.
A. Specificities of qualitative research methods
First, qualitative research encompasses all forms of field research performed with qualitative data. “Qualitative” refers to data in nonnumeric form, such as words and narratives. There are different sources for qualitative data, such as observations, document analysis, interviews, pictures or video’s, etc. Each of these data-gathering techniques has its particular strengths and weaknesses that have to be reflected upon when choosing for a qualitative research technique. In the social sciences, the use of qualitative data is also closely related to different paradigms trying to develop insight in social reality. Elaboration on these paradigms is however outside the scope of this process note [1].
Second, the aim of qualitative research is developing a “thick description[2]” and “grounded or in-depth understanding” of the focus of inquiry. The benefits of well developed qualitative data-collection are precisely richness of data and deeper insight into the problem studied. They do not only target to describe but help also to get more meaningful explanations on a phenomenon. They are also useful in generating hypotheses (Sofaer, 1999). Types of research questions typically answered by qualitative research are “What is going on? What are the dimensions of the concept? What variations exist? Why is this happening?” (Huston,1998). Qualitative research techniques are primarily used to trace “meanings that people give to social phenomena” and “interaction processes”, including the interpretation of these interactions (Pope, 1995). “They allow people to speak in their own voice, rather than conforming to categories and terms imposed on them by others.” (Sofaer, 1999, p. 1105). This kind of research is also appropriate to investigate social phenomena related to health (Huston,1998).
Third, one of the key strengths of qualitative research is that it studies people in their natural settings rather than in artificial or experimental ones. Since health related experiences and beliefs are closely linked to daily life situations it is less meaningful to research them in an artificial context such as an experiment. Therefore data is collected by interacting with people in their own language and observing them in their own territory (Kirk, 1986) or a place of their own choice. This is also referred to as naturalism. Therefore the term naturalistic methods is sometimes used to denote some, but not all, qualitative research (Pope, 2006). Also this characteristic is not always relevant to the use of QRM at the KCE. For example focus group interviews are usually not performed in the natural setting of the participants, but rather in the setting of a meeting room.
A fourth feature of qualitative research in health care is that it often employs several different qualitative methods to answer one and the same research question (Pope, 2006). This relates partly to what is called triangulation (see here).
Finally, qualitative research is always iterative starting with assumptions, hypotheses, mind sets or general theories which change and develop throughout the successive steps of the research process. It is desirable to make these initial assumptions explicit at the beginning of the process and document the acquired new insights or knowledge at each step.
[1] For those interested we refer to Denzin and Lincoln, 2008 a, Denzin and Lincoln, 2008 b, Bourgeault et al., 2012 or in Dutch, Mortelmans, 2009
[2] A “thick description” of a human practice or behavior include not only the focus of the study, but its context as well, such it becomes meaningful to an outsider. The term was introduced in the social science literature by the anthropologist C. Geertz in his essay in 1973
B. Qualitative versus quantitative approaches
Although it is meaningful to do qualitative research in itself, qualitative research is often defined by reference to quantitative research. Often it is assumed that because qualitative research does not seek to quantify or enumerate, it does not ‘measure’. Qualitative research generally deals with words or discourses rather than numbers, and measurement in qualitative research is usually concerned with taxonomies or classifications. “Qualitative research answers questions such as, ‘what is X, and how does X vary in different circumstances, and why’, rather than ‘how big is X or how many X’s are there?”(Pope, 2006, p3).
By emphasizing the differences the qualitative and quantitative approach are presented as opposites. However, qualitative and quantitative approaches are complementary and are often integrated in one and the same research project. For example in mixed methods research the strengths of quantitative and qualitative research are combined for the purpose of obtaining a richer and deeper understanding (Zang, 2012). Also qualitative data could be analyzed in a quantitative way by for example counting the occurrence of certain words.
Often health services researchers draw on multiple sources of data and multiple strategies of inquiry in order to explore the complex processes, structures and outcomes of health care. It is common that quantitative and qualitative methods answer different questions to provide a well-integrated picture of the situation under study (Patton, 1999). Especially in the field of health services research qualitative and quantitative methods are increasingly being used together in mixed method approaches. The ways QRMs could be used combined or not, are:
Qualitative research only:
- To know the variation in experiences related to health or illness.
- To build typologies regarding health services use, patient attitudes, health beliefs, etc.
- Qualitative preliminarly to quantitative:
- To explore new area, new concepts, new behaviour, etc.(Pope, 1995) before to start with measurement.
- To build quantitative data collection tools (questionnaires): using appropriate wording (Pope, 1995), variables to submit, to develop reliable and valid survey instruments (Sofaer, 1999), etc.
- To pre-test survey instruments(Sofaer, 1999).
- In supplement to quantitative work:
- As a part of a triangulation process that consist in confronting results coming from several data sources (Pope, 1995).
- To reach a different level of knowledge (Pope, 1995): “If we focus research only on what we already know how to quantify, indeed only on that which can ultimately be reliably quantified, we risk ignoring factors that are more significant in explaining important realities and relationships.” (Sofaer, 1999, p. 1102).
- In complement to quantitative work by exploring complex phenomena or areas that are not reachable with quantitative approaches (Pope, 1995).
- Sofaer (Sofaer, 1999) provides us the insight that in many cases, inquiry can move from being unstructured, largely qualitative in nature, to being structured and largely quantitative in nature. This is how she describes the continuum: “(…) there is uncertainty not only about answers, but about what the right questions might be; about how they should be framed to get meaningful answers; and about where and to whom questions should be addressed. As understanding increases, some of the right questions emerge, but uncertainty remains about whether all of the right questions have been identified. Further along, confidence grows that almost all of the important questions have been identified and perhaps framed in more specific terms, but uncertainty still exists about the range of possible answers to those questions. Eventually, a high level of certainty is reached about the range of almost all of the possible answers.” (p. 1103).
- In sum, over time investigations related to a certain area, start with qualitative research to explore the field, find the right questions, prepare for more focused questions and discover theories and hypotheses. Next, quantitative research is in place to test hypotheses and finally, qualitative research can be used to deepen the findings or to search for explanations quantitative research techniques cannot provide.
3. How to collect?
<This chapter will be published in December 2013>
3.1 Interviewing (individuals, groups)
There are many ways to interview people, e.g. individually or in focus groups. However, they share some general principles and techniques. Therefore in what follows we address the general principles. After that we present a chapter on individual semi-structured interviews and a chapter on focus groups.
3.1.1 General principles
| Attachment | Size |
|---|---|
| fig2_interviewing_people.png | 91 KB |
| fig3_conceptualisation.png | 37.37 KB |
3.1.1.1 How to plan the research design?
As with any data collection, interviewing (individually or in focus groups) has to be planned within the overall research approach taking into account the particular aims of the qualitative data collection.
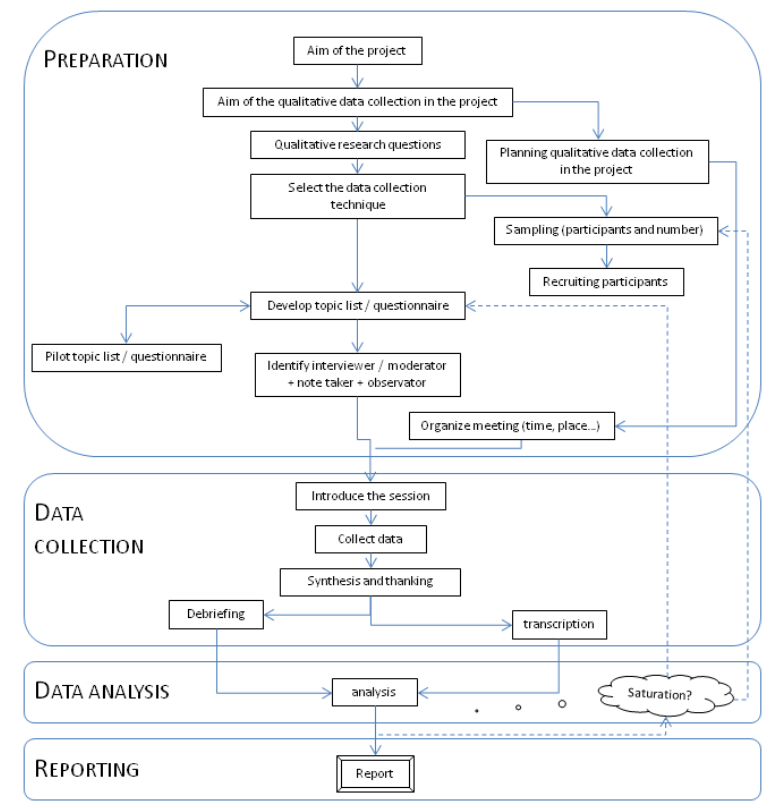
The planning of data collection has to be prepared early in the process of the overall research. Qualitative research is time consuming, on the level of data-collection, data-analysis and reporting. All the steps are presented in the next figure.
Figure 2 – Flowchart: interviewing people

3.1.1.2 Sampling issues in qualitative research: who and how many?
Selection of participants
In qualitative research we select people who are likely to provide the most relevant information (Huston 1998). In order to design the sample and cover all variability around the research issue, the researchers must have an idea about the different perspectives that should be represented in the sample. This is called “field mapping” of the key players who have a certain interest in the problem under study. The role of this explicit “field mapping” is often underestimated but essential in order to build a purposive sample. It is possible that this “field map” evolves during the data collection. The notion of “representativeness” here is not understood in the statistical way. The idea of representation is seen as a “representation of perspectives, meanings, opinions and ideas” of different stakeholders in relation to the problem researched and their interest. In order to select the participants for interviews or focus groups, one should ask “do we expect that this person can talk about (represent) the perspectives (meanings given to the situation) of this stakeholder group”. The aim is to maximize the opportunity of producing enough data to answer the research question (Green 2004).
Ideally there should be a mixture of different “population characteristics” to ensure that arguments and ideas of the participants represent the opinions and attitudes of the relevant population. Also the unit of analysis should be taken into account. This could be for example “individuals for their personal opinions/experience/expertise” or “individuals because they represent organizational perspectives”.
Moreover in order to make comparisons within and between types of participants, the sample design should take this already into account. In Table 9, two criteria for comparison, for example age and socio-economic status, are already included to allow comparative analysis between age or status groups.
Sampling approaches
There is a wide range of sampling approaches (e.g. Miles and Huberman 1994, Patton 2002, Strauss and Corbin 2008). It is not uncommon in qualitative research that the research team continues to make sampling decisions during the process of collecting and analysing data. However, a clear documentation of the sampling criteria is needed when doing qualitative research. These criteria should cover all relevant aspects of the research topic. The researcher should identify the central criteria and translate them in observable sample criteria. In addition, the chosen criteria should leave enough variation to explore the research topic (Mortelmans, 2009). For example, in a research about factors influencing the decision to have or refrain from having a refractive eye surgery in the two last years, sampling criteria were:
- To have experienced or to have considered a refractive surgery. We want to explore both the pro and cons.
- To be older than 20 and younger than 70. Refractive eye surgery is not an option for those younger than 20 or older than 70.
In what follows we describe a number of sampling strategies. All the sampling strategies are non-probabilistic. A randomized sample is not useful in qualitative research, since generalizability to the general population is not the aim. Moreover with a random sample the researcher would run the risk of selecting people who have no link with the research subject and thus nothing to tell about it (Mortelmans, 2009). In purposive sampling the point of departure are the sampling criteria as described above. There are different forms of purposive sampling:
- Stratified purposive sampling (Patton, 2002):
Purposive samples can be stratified (or nested) by selecting particular persons that vary according to a key dimension/characteristic (e.g. a sample of people from large hospitals, and a different sample with people from small hospitals) and the selection ideally represents the different positions within the ‘system’ or phenomenon under investigation. The stratification criteria are the equivalent of independent variables in quantitative research. The researcher should think ahead about independent variables which could provide new information regarding the research topic. For example, in the research project on refractive eye surgery we expected that reasons to chose or refrain from chosing for refractive eye surgery vary with age, with financial resources and can be different in the Dutch- and French-speaking part of the country. Therefore we added age, socio-economic status and region as criteria introducing heterogeneity. This results in the following matrix: - Homogeneous sampling:
In the case of homogeneous sampling variation between respondents is minimised. Participants are chosen because they are alike, in order to focus on one particular process or situation they have in common (Mortelmans, 2009) . However the homogenous character does not exclude comparisons between types of participants, because for example unanticipated dimensions might emerge from the data. It is also useful to take into account hierarchy, hence not to put for example nurses and specialists working in the same hospital together in a focus group, as this might create bias in the responses.This sampling strategy is used when the goal of the research is to develop an in-depth understanding and description of a particular group with similar characteristics or people on equal foot. For example for the KCE research project on alternative medicines 48-50 only regular users were sampled.
Table 9 – Example of stratified purposive sample
|
Already had eye surgery or surgery planned |
Considered eye surgery but refrained from having it |
|||||||||||||||||
|
Age |
20-30 |
31-40 |
>40 |
20-30 |
31-40 |
>40 |
||||||||||||
|
Socio-economic status |
a |
b |
c |
a |
b |
c |
a |
b |
c |
a |
b |
c |
a |
b |
c |
a |
b |
c |
|
Number of respondents |
2 |
2 |
2 |
2 |
2 |
2 |
2 |
2 |
2 |
2 |
2 |
2 |
2 |
2 |
2 |
2 |
2 |
2 |
- Heterogeneous or maximum variation sampling :
In the case of heterogeneous sampling variation between repondents is maximised, relevant to the research question. - Extreme or deviant cases sampling:
For some purposes it can be useful to search for outliers or highly unusual persons or representatives of opinions. A selection of persons that, emerging from an analysis, appear to be the 'exception to the rule' could be considered to get a better understanding of these outliers or “negative cases”. The process of identifying extreme or deviant cases occurs after of the data collection and analysis have been partially completed. Therefore it is a sampling strategy which is always conducted as complementary to other sampling strategies. - Typical case:
Cases are selected from which it is expected that they will provide information about a typical situation. This strategy is used in case of a new research area. If knowledge about a research topic is completely absent, a typical case can provide the basic knowledge necessary to construct theoretical explanations, preparatory to the search for more variation in cases. The typical case is one that occurs frequently (Mortelmans, 2009). - Critical case sampling:
This sampling is especially used in case studies, a research strategy “to understand social phenomena within a single or small number of naturally occurring settings. The purpose may be to provide description through a detailed example (…)” (Bloor and Wood, 2006, p. 27). It can be used when time or resource constraints limit the possibilities to recruit participants. A small number of important cases is selected to "yield the most information and have the greatest impact on the development of knowledge" (Patton, 2002, p. 236). It is crucial that the research team identifies the dimensions that make the participants “critical”. Snowball sampling can be used to identify critical informants who can provide a great deal of information about a phenomenon. - Theory-based or theoretical sampling:
Theoretical sampling refers to the process of selecting "incidents, slices of life, time periods, or people on the basis of their potential manifestation or representation of important theoretical constructs" (Patton, 1999, p. 238). - Confirming and disconfirming cases:
Identification of confirming and disconfirming case occurs after data collection and analysis has partially been completed. Cases are sought to lend further support to an initial analysis or theory (confirming cases), or to disconfirm the theory and provide rival explanations (disconfirming cases). Researchers seek out confirming and disconfirming cases in order to develop a richer, more in-depth understanding of a phenomenon and to lend credibility to one's research account.
Recruitment strategies
In order to achieve the expected sample, several ways to find and recruit participants could be suggested:
- Convenience sampling:
It is a pragmatic solution, i.e. selecting respondents based on ease, speed, and low cost, without any in-depth considerations on the selection of the participants. This strategy should ideally be avoided 33, but in some cases it is the only feasible option due to practical reasons (such as time, costs, etc.). A good description of the sample is especially important with convenience sampling, so that the reader can know how the results came about. - Snowball sampling:
This strategy is especially used when the researcher has no clear idea about where to search for respondents or who could provide him with the information he envisions. Hence the researcher searches for one or a few respondents and asks them who else they know could provide information. These individuals are contacted and in their turn asked whether they know other potential respondents. Once indivuals the same names are mentioned, the sample has reached his maximum size (Mortelmans, 2009) . - At random, but still purposive:
As already mentioned above a random selection as such is not useful in qualitative research. However, there is one exception: random selection can be used when the researcher by using one of the sampling strategies mentioned above, gets more cases than he can interview or observe with his available time and resources. In that situation randomness can be an additional selection criterion (Mortelmans, 2009).
Sample size
“Determining adequate sample size in qualitative research is ultimately a matter of judgement and experience in evaluating the quality of the information collected against the uses to which it will be put, the particular research method and purposeful sampling strategy employed, and the research product intended” (Sandelowski, 1995, p. 199).
Typically, in qualitative research one should continue sampling until saturation is reached– this is the point at which no new information or themes are emerging from the data35. Therefore sampling goes hand in hand with data analysis and cannot be planned totally in advance. In reality in every research institution, the sample size is also determined in function of the budget, the time and human resources available. This means often practical aspects of the research project may constrain the size of the sample before theoretical saturation is reached. This is also true for KCE working practice, since budgets and time schedules are limited and fixed.
Beware that saturation can be reached prematurely if one's sampling frame is too narrow, if one's analytical perspective is biased or limited; if the data collection method is not resulting in rich, in-depth information or when the researcher is unable to get beyond the surface.
First contact with a respondent
- The first contact with a respondent is often made by telephone. It is very important as it will set the tone for the rest of the interviewing. During this telephone conversation the researcher must convince the respondent of the importance of the research and his participation. To convince the researcher could search for arguments that are important in the eyes of the respondent, rather than arguments in function of the importance of the research. Not too much information should be provided during this first contact. Additional information can be provided by means of an information letter. Box 1 presents information that can be provided during the invitation to participate.
Box 1: Information to be given during first contact
Background information
- Goal of the interview
- Reason why the respondent is invited to participate
- How the respondent was recruited
- Reason why the respondent is called at that specific moment in time
- The recording of the interview
Person responsible for the research
Arguments pro praticipation
- How the results of the research will be reported, including (non)anonymity issues (e.g. in quotations)Influence of the results on policy making
Costs of the participation
- The kind of information the respondent is expected to provide
- The duration of the interview
- (Non) anonymity of the provided information
- How the recording of the interview will be treated after the interview
Source: Adapted from Emans, 1986 cited by: Mortelmans, 2009
It is important that people understand that participation in interviews or focus groups is completely voluntary, and that they may choose to leave at any time during the discussion. In addition, it is imperative that participants are aware that they will receive no tangible benefit for participation. That is why the question on offering incentives is often rather contentious (Green et al., 2009). Nevertheless their traveling costs could be reimbursed or they can receive a slight compensation or a small gift.
Also it is recommended to leave the choice of place (where the interview will take place) up to the respondent, in order to facilitate his participation. The context in which the interview takes place determines partly the interactions during the interview. For example a patient at home or in the waiting room of a hospital will disclose other kinds of information, not only because he/she feels more or less comfortable, but also because the setting triggers other associations and thoughts. The interviewer/researcher should be well aware of and anticipate the impact the interview location is likely to have on the data generated.
The same accounts for the characteristics of the interviewer. In the qualitative interview the researcher empathizes with his or her respondents and views their situation from their own points of view53. In general this empathic stance as well as gaining trust from the respondent, is facilitated if the interviewer resembles the respondent in terms of race or other characteristics relevant to the research topic. Gender however is an exception to this rule. There is a debate in the literature about whether same sex or opposite sex is preferable in order to achieve rapport during interviews. Some argue that men are more comfortable in talking with women (especially about intimate topics) that they are with other men (Williams, 1993).
3.1.1.3 How to develop an interview guide?
An interview guide should be adapted to the language and vocabulary of the participant(s) and is generally built out of three components:
- A reminder of the goal of the research.
- The main topics or questions, the interviewer wants to address during the interview.
- Relaunching questions. They are an essential part of the interview. It may happen that the interviewee does not give an answer to the question or gives an unexpected answer. In that case the interviewer can probe in order to delve deeper. In case a respondent does mention an aspect you thought of in advance or you are particularly interested in, you can repose the question focused on that specific issue. For example the initial question could be: “Which difficulties you experienced after your surgery?”. The respondent mentions all kinds of worries and inconveniences, but you are particularly interested in the organization of after care. Hence you could ask: “How did you experience the organization of after care?”.
How to construct a topic list or semi-structured questionnaire?
A topic list covers all the topics the interviewer should ask during the interview. It enables the interviewer to guide the interview while allowing the discussion to flow naturally. The sequence of topics generally moves from the general to the specific. The sequencing of topics can be introduced in a flexible way, and within a general framework of topics, the focus of the discussion can be reset. A topic list is also used in preparation of the semi-structured questionnaire
In a questionnaire semi-structured questions are formulated in speaking language and are posed as such during the interview. The same questions with the same formulation, sometimes in the same sequence, are posed in each interview. The disadvantage however is that it can threaten the natural flow of the conversation.
Both for the topic list and the semi-structured questionnaire, questions/topics should evidently be selected in function of the research objectives. An open ended-formulation of the questions is important in order to enable the interviewee to talk freely without predispositions of the interviewer influencing the narrative. For example, rather than asking “Did you worry about the surgery?”, one could ask “How did you feel about the surgery?”.
A topic list or questionnaire may be adapted or improved in the course of the research, in line with the iterative nature of QRM. The more interviews you have done, the more you know and the more specific or detailed your questions can be (Mortelmans, 2009). However, continuity should be guarded. The topics of the first interview should also be represented in the following interviews, although the latter can also contain much more detailed questions.
For an example of a topic list and a semi-structured questionnaire, see Appendix 6 and Appendix 7 respectively.
What types of questions can be posed?[a]
The interview starts with an easy opening question which is mostly to set the interviewee at ease, break the ice and get to know each other. With this question the researcher does not expect to get a lot of useful information, the main function is to start up the conversation.
After that the conversation is started with a first general and easy to answer question addressing the content of the research. It can be an attitude question to enable the respondents to roll into the conversation. An example could be: “If you hear breast cancer screening, what are your first thoughts?”.
Next, transition questions involve the respondents in the research subject, for example through asking questions about personal experiences or specific behavior regarding the topic. Attitudinal questions are more difficult to answer and should therefore be addressed later in the interview. An example is “How did you experience your eye surgery?”.
Subsequently the key questions are addressed. These questions are the reason why the interview is done. The interviewer can make clear that the interviewee can take some time to answer these questions. An interview can count up to five key questions each taking up to fifteen minutes to answer them.
Finally, the interview is terminated by means of a concluding question and thanking the interviewee for his participation. Three types of concluding questions can be distinguished:
Summary questions provide the interviewee with a summary of what he has told the interviewer,Final questions can address elements that have not been mentioned during the interview, for example: “Do you want to add something to this interview?”. Make sure you allow enough time for the concluding questions.
It is useful to conduct a pilot (focus group) interview in order to test, assess and validate the format and the appropriateness of the topic guide or questionnaire.
3.1.1.4 How to run the data collection?
Preparations for the interview
Preparations for the interview encompass the recruitment of participants and the making of appointments, becoming knowledgeable about the research topic, including learning the interview guide by heart, anticipating questions of participants regarding the research project, access to a physical space where the interviews can take place and preparation of the recording equipment (Mack,2005). Well functioning of the recorders is crucial, so batteries, tapes and microphones should be carefully checked. It could be practical to foresee a second recorder as back-up. Finally also a notebook, a pen, and of course the topic list or interview guide you prepared for the interview should not be forgotten.
Box 2: What to take to the interview?
Equipment
- digital tape recorder (plus 1 extra, if available)
- Spare batteries
- Field notebook and pens
Interview packet
- 1 interview guide (in the appropriate language)
- informed consent forms (2 per participants: 1 for interviewer, 1 for each participant, in the appropriate language)
- Participant reimbursement (if applicable)
Source: Adapted from Mack, 2005
Running the interview
Informed consent should be obtained from each participant before starting the interview. Also permission should be asked to record the interview. Also it should be explained how the tapes will be used and stored.
The research aims should be briefly repeated. Probably the research aims were already explained during the first contact with the respondent in order to convince him of participating. Next, all the topics or questions on the checklist or questionnaire need to be addressed. Participants are probed for elaboration of their responses in order to learn everything they want to share about the research topic54. Mobile phones should be switched off during the interview so as not to imply that the participant’s testimony is of secondary importance.
During the interview back-up notes could be taken, the interviewee’s behaviors and contextual aspects of the interview should be observed and documented as part of the field notes. Field notes are expanded as soon as possible after each interview, preferably within 24 hours, while the memory is still fresh (Mack,2005).
To get deeper or redirect the discussion, probing techniques can be used:
- Repeat the question but in a different wording.
- Summarise the anwer the relevant aspects of the interviewee’s answer, in an interrogative way. For example: “In sum, you say that…?”
- Probe explicitly, for example: “What do you mean?” or “Could you give me a second example?”
- Purposive probing, for example: “Why was it that you?” or “What happened then?”
- Repeat the last couple of words in an interrogative way. For example: “R: (…) I think it is dangerous and I don’t trust doctors”. I: ”You don’t trust doctors?”
- Introduce a short silence.
- Verbalise emotions, for example: “I can see that thinking of that discussion makes you very angry.”
The interview is closed by thanking the participant(s).
3.1.1.5 How to prepare the data for analysis?
Transcribing is the procedure for producing a written version of the interview. Ideally, the information recorded during the interview will need to be transcribed in order to enable accurate data analysis. A transcript is a full written literal text of the interview. It often produces a lot of written text.
Good quality transcribing is not simply transferring words from the tape to the page. The wording communicates only a small proportion of the message. A lot of additional information is to be found in the way people speak. Tone and inflection, timing of reactions are important indicators too. With experienced observers and note-takers, a thematic analysis of the notes taken during the interviews could be used as a basis for analysis of the “non-verbal” aspects.
Transcribing is a time consuming and costly part of the study. The research team should consider in advance the question "who should do the transcribing”? Resources may be needed to pay an audio typist, a strategy usually more cost effective than a researcher. Be aware that “typists” are often unfamiliar with the terminology or language used in the interviews which can lead to mistakes and/or prolong the transcribing time.
It may not be essential to transcribe every interview. It is possible to use a technique known as tape and notebook analysis, which means taking notes from a playback of the tape recorded interview and triangulating them with the notes taken by the observers and note-takers. However, bias can occur if inexperienced qualitative researchers attempt tape and notebook analysis. It is certainly preferable to produce full transcripts of the first few interviews. Once the researcher becomes familiar with the key messages emerging from the data tape analysis may be possible. Transcripts are especially valuable when several researchers work with the same data.
3.1.1.6 What are the common pitfalls?
In the following paragraph we mention a number of common pitfalls typical for interviews. They are based on the work of Mortelmans (Mortelmans, 2009) and the Qualitative Research Guidelines Project (Cohen, 2008).
- The methodology needs to be transparent. Each step of the sampling, data collection and analysis should be described in sufficient detail, this means that it must enable other researchers to replicate the same study.
- The sample should be well constructed and described.
- Avoid dichotomous questions which elicit a yes or a no. In an interview we are especially interested in rich descriptions and we want the interviewee to talk a lot and elaborate on the topic of the question.
- Avoid double questions, for example: “Once you decided to have a screening, what was the next step? How did you proceed? How did it change the way you thought about potential risks?” The interviewee can not respond to all the questions at once and thus picks out one. This means the other questions are lost.
- Avoid the expression of value judgements or your own opinion, for example: “What do you think about the endless waiting times?” The word “endless” suggests irritation.
- Avoid to be suggestive, for instance by giving examples: “Which kind of difficulties did you encounter, like long waiting times, full waiting rooms etc?” This kind of examples provide the interviewee with a frame, which he will possibly not transcend. This way you loose what he would have answered spontaneously.
- Avoid a reverse of roles. The interviewee should not be asking you questions. An example could be: I: “What does it mean to you to be a patient?”, R: “I don’t know. What does it mean to you?”. If this happens you can say that you are willing to answer that question after the interview, but that you can not answer it during the interview in order not to influence the answers of the interviewee. A reverse of roles can be avoided if the interviewer introduces himself in a neutral way, for example as a researcher, but not as, for example a physician or an expert in an issue related to the topic/goal of the interview, in order for the respondent not to ask you too many questions on a particular condition or issue.
- Avoid letting the interviewee deviate to far from the topic or elaborates on irrelevant matters by returning to the question posed.
- Avoid being too jargony, but use a familiar terminology which does not need explications or definitions.
- The analysis should not be superficial but really in-depth. However it may not transcend the data. The data must always support the results.
3.1.2 Individual interviews
3.1.2.1 What are individual semi-structured interviews?
Interviews are used in many contexts (journalism, human resource managers, etc.) and for many purposes (entertainment, recruitment of personnel, etc.), hence scientific data collection is only one very specific application, which should not be confused with other applications. The interview is easily trivialized as it is common practice in the media landscape which surrounds us. Fontana and Frey even speak about “the interview society” according to Atkinson and Silverman. Practicing health professionals routinely interview patients during their clinical work, and they may wonder whether simply talking to people constitutes a legitimate form of research (DiCicco-Bloom et al,2006). In qualitative research, however, interviewing is a well established research technique and two types can be distinguished: semi-structured and unstructured. Structured interviews are out of scope here, because they consist of administering structured questionnaires producing quantitative data.
Unstructured interviews are more or less equivalent to guided conversations(DiCicco-Bloom et al,2006). Originally they were part of ethnographers’ field work, consisting of participant observation and interviewing key informants on an ongoing basis to elicit information about the meaning of observed behaviors, interactions, or artifacts (DiCicco-Bloom et al,2006). There is no list of questions, nor an interview guide, the questions asked are based on the responses of the interviewee, as in the natural flow of a conversation (Britten, 1995).
Semi-structured interviews are often the sole data source in a qualitative research project. A set of predetermined open-ended questions is used to guide the interview, but other questions emerging from the dialogue can be added (Britten, 1995). Also the iterative nature of the research process in which preliminary data analysis coincides with data collection, results in altering questions as the research process proceeds. Even so, questions that are not effective in eliciting the necessary information can be dropped or replaced by new ones (Britten, 1995).
Essentially an interview consists of someone who asks questions (interviewer), someone who answers these questions (interviewee) and the registration of those answers in some way (Mortelmans, 2009).
The interview as qualitative research method differentiates from other forms of interviewing used in varied domains. Mortelmans pays attention to four characteristics:
- Flexibility; with flexibility internal and external flexibility is meant: external refers to the iterative use of interviewing and data analysis. Structure and content of the subsequent interview may be changed in function of the analysis of the previous one. Internal flexibility points to the fact that the sequence of the prepared interview questions and themes should stands in function of the interviewee in order to guard the natural flow of the conversation.
- The interviewee leads so to speak the conversation. The interviewer only guards the scope of the conversation and makes sure that all the topics are covered.
- Non-directiveness; the interviewee steers the interview and the interviewer only makes sure that the conversation does not stray too far by means of non-directive interview techniques.
- Direct face-to-face contact is important to built trust and get in-depth information, but this depends on the topic and should be considered case by case.
3.1.2.2 When to use individual semi-structured interviews?
Individual semi-structured interviews are useful to:
- Collect data on individuals’ personal histories, perspectives, and experiences, particularly when sensitive topics are being explored (Mack, 2005).
- Elicit a vivid picture of the participant’s perspective (Mack, 2005).
- Provide context to other data, offering a more complete picture (Boyce et al, 2006)
- Learn about the perspectives of individuals, as opposed to, for example, group norms of a community, for which focus groups are more appropriate (Mack, 2005).
- Get people to talk about their personal feelings, opinions, and experiences (Mack, 2005).
- Gain insight into how people interpret and order the world on the research topic (Mack, 2005).
- Address sensitive topics that people might be reluctant to discuss in a group setting (Mack, 2005).
- Elicit information from key informants (Sofaer, 1999).
- Examine people’s experiences, attitudes and beliefs (Huston et al, 1998).
3.1.2.3 Strengths and weaknesses of the method
Strengths:
- They provide much more detailed information than what is available through other data collection methods, such as surveys (Boyce et al, 2006).
- Questions can be prepared ahead of time. This allows the interviewer to be prepared and appear competent during the interview (Cohen, 2008).
- Semi-structured interviews also allow informants the freedom to express their views in their own terms (Cohen, 2008).
- Semi-structured interviews can provide reliable, comparable qualitative data (Cohen, 2008).
Weaknesses:
- Interviews can be time-intensive because of the time it takes to recruit participants, conduct interviews, transcribe them, and analyse the results. In planning your data collection effort, care must be taken to include time for transcription and analysis of this detailed data (Boyce et al, 2006).
- Interviewers must be appropriately trained in interviewing techniques. To provide the most detailed and rich data from an interviewee, the interviewer must make that person comfortable and appear interested in what they are saying. They must also be sure to use effective interview techniques, such as avoiding yes/no and leading questions, using appropriate body language, and keeping their personal opinions in check (Boyce et al, 2006)
- Data from individual semi-structured interviews are not generalizable in a statistical way, but they are theoretically transferrable, because small samples are chosen and no random sampling methods are used. Individual semi-structured interviews however, provide valuable information, particularly when supplementing other methods of data collection. It should be noted that the general rule on sample size for interviews is that when the same stories, themes, issues, and topics are emerging from the interviewees, then a sufficient sample size has been reached (Boyce et al, 2006).
3.1.2.4 How to plan the research design?
See “How to plan the research design?”
3.1.2.5 Modalities of data collection
Individual semi-structured interviews are usually conducted face-to-face and involve one interviewer and one participant. Phone conversations and interviews with more than one participant also qualify as semi-structured interviews, but, in this chapter, we focus on individual, face-to-face interviews (Mack, 2005).
3.1.2.6 Data collection tools
The data collection tools to carry out interviews are topic lists, questionnaires and field notes. Topic lists and questionnaires are described here.
Researchers use field notes to record observations and fragments of speech. Field notes should be written up as soon as possible after the events to which they refer. If possible, short “aide-mémoire” or pocket dictaphones may be used in fieldwork settings, to facilitate later expansion of the notes into proper fieldnotes (Bloor et al, 2006). In the chapter on observational techniques field notes are addressed in more detail (here).
3.1.2.7 Sampling
For general issues on sampling, see “Sampling issues in qualitative research: who and how many?”.
3.1.2.8 Human resources necessary
In the ideal scenario researchers plan, organize, carry out and transcribe the interviews themselves, to be completely immersed in the data, but in practice the interviews are often carried out by subcontractors and the transcriptions are often done by professional typists.
3.1.2.9 Practical aspects
Preparations for the interview see “How to run the data collection” .
Physical organisation of an interview. Take the following rules into account:
- Interviewee and interviewer should not sit opposite each other, but rather at an angle of 90° or less.
- The interview should take place in a quiet place where the interviewee feels at ease.
- Avoid the presence of third parties.
3.1.2.10 Analysis and reporting of findings
See "How to prepare data for analysis", “How to analyse?” and “How to report qualitative research findings?” .
3.1.2.11 Examples of KCE reports using the method
- Home monitoring of infants in prevention of sudden infant death syndrome (Eyssen et al, 2006)
- Making general practice attractive: encouraging GP attraction and retention (Lorant et al, 2008)
- Osteopathy and chiropractic: state of affairs in Belgium (De Gendt et al, 2010)
- Acupuncture: state of affairs in Belgium (De Gendt et al, 2011)
- Homeopathy: state of affairs in Belgium (De Gendt et al, 2011)
- Burnout among general practitioners: prevention and management (Jonckheer et al, 2011)
- Evaluation of a fixed personal fee on the use of emergency services (Gourbin et al, 2005)
[1] We propose a example of a ‘standard introductive text’ in appendix.
3.1.3 Focus groups
3.1.3.1 What are focus groups ?
A focus group is a particular technique in qualitative research. In order to do a focus group interview a group of individuals is gathered in function of their specific profile or characteristics to explore a limited number of “focused questions” (Sofaer,1999). Groups are generally homogenous on a or several criteria relevant to the focus of the discussion.
“In essence, a focus group is a small (usually 6-12 people) group brought together to discuss a particular issue (..) under the direction of a facilitator who has a list of topics to discuss” (Green and Thorogood, 2009, p. 111).
Focus groups are group semi-structured interviews used for the purpose of collecting information focused on a specific subject or area of concern, for exploration and discovery, in-depth understanding of a problem as it is experienced in context, to assess needs, preferences, attitudes and interests related (in the context of KCE research) to health and health care issues.
It differs from individual semi-structured interviews, as the interaction component is used to bring out insights and understandings in ways which questionnaire items or individual questions may not be able to do. The interaction between the moderator and the group, as well as the interaction between group members, may result in more in-depth information, and to elicit differing perspectives related to carefully designed questions. Focus groups are thus not to be considered as a pragmatic time saving substitute for individual semi-structured interviews (e.g. if for any reason the planning does not allow for individual interviews), as the methodological groundings of both techniques differ.
A focus group is not synonymous to ‘group interview’: For a focus group, people are recruited specifically to participate in a research protocol, using a certain method. It is a group interview in the sense that it gathers data simultaneously from different participants (Green and Thorogood, 2009) However it differs from a group interview in the importance that is attached to the interaction among participants. Participants might change their perspective during the focus group interview because of this interaction. In a group interview the interaction between participants is limited, and occurs mainly between interviewer and interviewees.
Figure 4 – Interaction patterns in a group interview versus focus group interview
Depending on sampling strategy and aims, group interviews can take several forms, e.g. consensus panel, focus group, natural group or community interview (Coreil 2005 cited by Green and Thorogood, 2009).
Focus groups can be used as a single research strategy, as well as in combination with other methods in a multi-method research strategy.
3.1.3.2 Specific questions suitable for the method
The principal feature of focus group interviews is interaction between participants. Kitzinger (2006, p. 22) highlights that this particularity could be used to:
- “Highlight the respondents’ attitudes, priorities, language and framework of understanding.
- Encourage participants to generate and explore their own questions, and to develop their own analysis of common experiences.
- Encourage a variety of communication from participants – tapping into a wide range and different forms of discourse.
- Help to identify group norms/cultural values.
- Provide insight into the operation of group social processes in the articulation of knowledge (e.g. through the examination of what information is sensitive within the group.
- Encourage open conversation about embarrassing subject and to permit the expression of criticism.
- Facilitate the expression of ideas and experiences that might be left underdeveloped in an interview, and to illuminate the research patient’s perspectives through the debate with the group.”
- Allow topics which participants have given little thought in advance to emerge from the discussion (Barbour, 2010).
3.1.3.3 Strengths and weaknesses of the method
The benefits from focus groups highlighted are:
- Interaction between participants (Green and Thorogood, 2009)
- Ability to produce a large amount of data on a topic in a short time (Cohen et al, 2008)
- Access to topics that might be otherwise unobservable (Cohen et al, 2008)
- Access to explore sensitive topics, such as dissatifaction with a service: it can be easier for an interviewee if negative ideas are reported as coming from a group than from one single person (Green and Thorogood, 2009)
- Ability to insure that data directly targets researcher's topic (Cohen et al, 2008)
- Access to comparisons that focus group participants make between their experiences. This can be very valuable and provide access to consensus/diversity of experiences on a topic (Cohen et al, 2008)
The limitations of focus groups are related to the limitations of group interviews:
- Inappropriate to uncover marginal or deviant opinions (Green and Thorogood, 2009)
- Importance of social norms: participants are influencing each other, creating a certain kind of implicit norm (Baribeau, 2010), or consensus.
- Otherwise, group dynamics may contribute to cristallization of opinions.
- Not easy to organize: several selected people have to be gathered in the same place during a couple of hours .
3.1.3.4 How to plan the research design?
Since focus group interviews are a collective data collection technique requiring direct person-to-person contact (several people have to come together at the same moment and in the same place) a careful planning of all activities and related tasks is necessary.
3.1.3.5 Modalities of data collection
The data collection by focus group could vary according to (Cohen et al, 2008):
- The level of standardization of the questions
- The number of focus groups
- The number of participants in each groups
- The level of implication of the moderator
3.1.3.6 Data collection tools
During the preparation of the focus group interviews a set of topics or questions is developed and takes the form of a topic list or questionnaire. For the general principles, see here
A focus group interview is in most cases a structured group process structured by means of an agenda to keep the group focused and on track. A focus-group should be experienced as free-flowing and relatively unstructured, but in reality, the moderator must follow a pre-planned script of specific issues and set goals for the type of information to be gathered. An introduction of up to 15 minutes should be carefully planned, as well as a good opening question. In order to keep the time schedule, as several people are going to participate and answer to the questions, it is important to foresee a maximum duration for each question.
The use of a well designed guide is helpful to compare information from one group to another as it is expected to have more than one focus group for a given topic.
3.1.3.7 Sampling
For general issues on sampling, see “Sampling issues in qualitative research: who and how many?”
Identification of units of analysis
The starting point for selecting participants for focus groups is to identify the unit of analysis. Is the unit of analysis “individuals for their personal opinions/experience/expertise”, or is it “individuals because they represent organizational perspectives”? It has a major impact on the people invited to the focus group interview and therefore it should be clearly described.
The sample of focus groups will consist of groups of people, instead of individuals. People who are invited to take part need to have an interest in the subject.
Composition of the groups
Ideally groups have to be internally homogenous on criteria relevant to the topic but externally heterogeneous between groups. Homogeneity in the group capitalizes on people’s shared experiences (Kitzinger, 2006).
It is best to select people who do not know one another, but have similar relationships with the topic being investigated (although it could in practice be difficult for particular topics). Selecting participants who are similar may help them to share ideas more freely and develop an in-depth analysis of a topic (homogeneous groups).
Sometimes, heterogeneous groups can be used after the primary analysis of homogeneous focus groups has started. Heterogeneous groups are used to “confront” diverging opinions. In general terms, heterogeneous groups are composed of representatives of all relevant stakeholders.
In this case, the researcher has to pay attention to potential power differences or inequalities between participants. This may prevent some people from talking freely during the discussion and by consequence prevent the collection of rich data (Kitzinger, 2006).
In the Belgian context, focus group interviews can be carried out with French-speaking or Dutch-speaking and even German-speaking, participants. It is advisable to conduct unilingual groups: it is easier and richer for facilitators and participants. For heterogeneous groups, like stakeholders samples, it could be difficult to separate people in groups according to their mother tongue. In this particular case, it is important that participants express themselves in their mother tongue and to be sure that every participant understands the other language. The moderator has to be thus perfectly bilingual.
Number of participants per group
A group of six to twelve people is sufficient for a focus group. The ideal size for a focus group is eight to ten respondents. In general, the smaller the group, the more manageable it is. From experience, a group of 6‑8 participants allows enough time for discussion and is easier to manage. Where the purpose is to generate in-depth expression from participants, a smaller group size may be preferable in combination with carrying out more focus groups to attain saturation.
In order to make sure that a group counts enough participants, it is advisable to recruit 25% more people than required (Green and Thorogood, 2009). If too few participants turn up, one should foresee an additional focus group to substitute for the low attendance.
Number of groups
The number of focus group interviews needed depends on the aims and available resources . It is almost impossible to give clear standardized guidelines on the number of focus groups needed.
It is methodologically important for both approaches to conduct at least two focus groups by ‘type of people’. Using only one focus group to arrive at conclusions is risky since the opinions expressed may have had more to do with the group dynamics (i.e. persuasive skills of one or two members) than a true sampling of the opinions of the population that the group represents. Even the preset number of two focus groups is generally too limited to make in-depth analyses, especially if the topics discussed are rather “broad” or general (see also paragraph analysis on continuous comparative method). Having two homogeneous groups that provide different results suggests that more information is necessary (data saturation is not reached). One rule of thumb is to conduct focus groups until they no longer provide any new information on the topic discussed.
3.1.3.8 Human resources necessary
Three people (from the research team) could chair the focus group interview:
- The moderator (also called ‘facilitator’) plays a crucial role in the success of a focus group interview and can have a major impact on the outcomes of the data collection. He should lay down some ‘rules’, explain the duration of the focus group interview, plan a break in between, make everybody welcome before hand, do the paperwork (e.g. informed consent) before actually starting the interview. Before the opening question, is it important to ask everybody to introduce themselves briefly. He has “to establish a relaxed atmosphere, enable participants to tell their stories, and listen actively” (Green and Thorogood, 2009, p 126.). Facilitating or moderating focus group interviews requires particular competencies: interpersonal skills (including non-verbal communication skills) are needed as well as a non-biased attitude towards the issues discussed. A focus group moderator should be able to keep the discussion on track and make sure every participant is heard. He/she has to be able to summarize what has been said, to structure the discussion. However he/she should not take position, avoid to make quick assumptions or conclusions, avoid to develop answers for the participants or give advice. Focus groups are intended to make in-depth studies of the perceptions, attitude and opinions of the participants, not of the research team (or moderator). The moderator makes it socially acceptable for participants to have another point of view. If participants get off track or get ahead of the issue being discussed the moderator must pull the group back together. He/she does not need to be an expert in the domain of the research.The moderator needs to use “probing techniques” when necessary: probing is essentially a means of further investigating a topic that has already been introduced. Probing can be used to clarify, to obtain more detail and to assure completeness. For this purpose, see also here. In the particular case of focus group interviews, the moderator could use disagreements in the group to force participants to develop and elucidate their point of view. An experienced interviewer could decide whether or not to follow the lead of the interview or to return to the sequence of the interview guide1 In the particular case of bilingual groups, the moderator has to master both languages.
- The note-taker will take notes during the discussion while the moderator is introducing questions. The note-taker could sit next to the moderator. Nevertheless, pay attention that if he/she is typewriting on a laptop directly, the sound of the typing on the keyboard is not disturbing. Moderator and note-taker can take turns in asking questions and taking notes (this requires a well functioning team that clearly understands its roles and can adapt to the situation). It should be discussed and reported whether different or the same persons facilitate the respective focus group interviews.
- The observer is a third facilitator who could be useful to observe the focus group participants (non-verbal language) and to help the moderator in identifying not very talkative participants and in keeping time.
As focus group have to be transcribed afterwards. It is also useful to engage the services of an audio typist.
3.1.3.9 Running of data collection
For general principles see “How to run the data collection?”.
In the case of focus groups, once the group of respondents is gathered for the discussion, the moderator should give a brief introduction to set everybody at ease[1]. More concretely, the moderator should:
- Explain the purpose of the discussion, how the information collected will be used and reported.
- Introduce note-taker and observer who will remain in the room during the discussion.
- Explain that the discussion is for scientific purposes and that information will solely be used with the context of the research.
- Ensure participants that the rules of confidentiality apply to everyone in the room, including the note-takers, observers.
- Explain how names will be used (real names or pseudonyms).
- Explain the group rules (speak one at a time, avoid interrupting or monopolizing, etc.).
- If the discussion is to be tape-or video-recorded, obtain permission from the respondents first, and explain how the tapes will be used, stored and eventually destroyed. – Tip to increase the quality of the recording: use 2 recorders, preferably stereo recording, one at each side of the table: it is useful to understand everybody and prevent the loss of data in case of disfunctioning of the recorder.
The Moderator will then begin the focus group interview by asking an ‘icebreaker question’ to facilitate the discussion in the group. Afterwards, he/she will come to the focus of the discussion.
Immediately after the focus group a debriefing has to be foreseen with the moderators/facilitators. The debriefing part is an essential step for the analysis. The debriefing exercise is best supported by a template of dimensions, upon which the moderator/facilitator team needs to comment (example in Appendix).
The facilitators should review the notes taken during the focus group and have a first assessment of clarity and understanding.
They should discuss, compare and record observations or impressions about the group not readily apparent from the notes.
Discuss and record any insights or ideas emerging during the interviews while they are still fresh in the mind.
3.1.3.10 Practical aspects
Preparations for the interview
See also part “How to run the data collection? ”
Location & timing
- The location where the focus groups will be held should be carefully selected.
- Accessibility and transport issues (and mobility needs of participants) should be considered.
- Avoid noisy areas where it will be difficult for participants and the moderator to hear each other.
- The setting should be comfortable, non-threatening for the respondents. Refreshments should be provided.
- The focus group table can be organized before hand and this allows the researcher to place name tags in the way he wants.
- Seating should be arranged to encourage participation and interaction, preferably in a circle, with or without name tags. It can be discussed whether tables are needed. Moderators/facilitators (and note takers) should be integrated as much as possible within the discussion setting.
- The timing of the focus group interview need to be acceptable for all potential respondents in order to avoid selective “non-response” as much as possible (take into account the socio-demographic profiles of the targeted participants such as working times, daily activities, family life, etc.).
Duration
The length of the focus group should be between 1 and 3 hours.
Allow sufficient time at the beginning to welcome participants, give them an introduction and let them introduce themselves. This part should not take excessive time (about 10 minutes).
Material
Data are collected through different sources: audio or video-taping can be considered. When focus group interviews are recorded, the equipment should be of good quality and easy to use (check batteries and microphone). For larger groups, it may be necessary to use two tape recorders or multi-channel equipment, strategically placed to maximize the probability of recording contributions from all participants.
“Field notes” are an essential part during data collection. They capture all of the essential “non-verbal” information during the focus group interview.
Information has to be collected in an unbiased manner (avoid to filter out information as pre-interpreting it as unimportant, especially in the first focus groups).
The context of statements made during focus groups should be documented (important for giving meaning to the statements in the phase of analysis).
Try to capture nonverbal behavior of group participants (nonverbal reactions of other participants after a participant statement may indicate consensus or disagreement).
3.1.3.11 Analysis and reporting of findings
For issues on analysis, see “How to analyse the data?”.
In the particular case of focus groups, separate analyses have to be performed on data gathered “within-focus group” and continuously compared “between focus group”. This is also an iterative process.
It is important that statements be understood in the context which they were made. Nonverbal communication observed during the interview can also be very informative.
For reporting, see part “How to report qualitative research findings”
Note that findings are reported by focus group as unit of analysis and not by person.
3.1.3.12 Quality criteria
See section part “How to evaluate qualitative research?”
Vermeire et al propose a checklist specific to critical appraise the quality of focus groups in health care research articles in primary healthcare (Vermeire et al, 2002).
3.1.3.13 Examples of KCE reports using the method
- Evaluation of the Belgian reference reimbursement system (LePolain et al, 2010)
- Evidence-based content of the written information provided by the pharmaceutical industry to the general practitioner (Van Linden et al, 2007)
- Quality development in general practice in Belgium: status quo or quo vadis ? (Remmen et al, 2008)
- Mental health care reforms: evaluation research of ‘therapeutic projects’ (Schmitz et al, 2010)
- Emergency psychiatric care for children and adolescents (Deboutte et al, 2010)
3.2 Observation
“The purpose of participant observation is partly to confirm what you already know (or think you know) but is mostly to discover unanticipated truths. It is an exercise of discovery” (Mack, 2005, p. 23)
In this chapter we explicitly try to focus on direct observation, instead of participant observation. However, two remarks are in place. One, there is nearly always some participation involved in observing, unless the researcher is covered behind for example a one-way mirror. In all other cases the researcher is present in a setting, hence inevitably becomes part of the setting. Second, in the KCE context participant observation is unlikely to be applied because it is very time consuming, intensive and hence is not compatible with KCE working procedures. However, that does not mean that observational techniques are irrelevant to a KCE researcher. They can be very useful, for example in case of site visits. In the following chapter although participating is not the main goal, it often enters the logics and quotes used.
3.2.1 What is (naturalistic) observation?
Observing is more than looking around, it is actively registering information along a number of dimensions, namely places (physical place or setting), persons (the actors involved) and activities (a series of acts) 83. Observing means having attention for (1) the detail of the observation, (2) visual as well as auditory information, (3) the time dimension, (4) the interaction between people, and (5) making links with mental categories (Mortelmans, 2009).
Observing includes roughly three steps:
- A descriptive step; the researcher enters the research setting and gets a general overview of the social setting.
- A focused step; more focused observations are a step closer to the research question. The aim is to search for relationships or connections between several elements in his research question, for example X is a characteristic of Y, or X is the result of Y. More concrete, suppose a researcher wants to study the way emergency care is organized in Belgium, he would do some descriptive observations in the emergency department of hospitals to get an idea of the general structures and processes characteristic for emergency care. In a next step he turns to his research question which is about how cost-effectiveness of emergency care could be attained. Hence the focus of his observation will relate to all possible costs and which could be avoided.
- Selective step 83;
.In this last phase, after the researcher may have analysed his data (field notes), he may have identified a lack of information of one specific category of costs, e.g. cleaning and housekeeping costs, and may therefore decide to do extra observations in function of this specific aspect.
3.2.2 When to use observations?
- To collect data on naturally occurring behaviors in their usual contexts54. Observation also captures the whole social setting in which people function by recording the context in which they live84.
- Unstructured observation illustrates the whole picture, captures context/process and informs about the influence of the physical environment84.
- To check whether what people say they do is the same as what they actually do84. Both what people perceive that they do and what they actually do are however valid in their own right and just represent different perspectives on the data84.
- Observation is also an ongoing dynamic activity that is more likely than interviews to provide evidence for processes, things that are continually moving and evolving84.
- To study the working of organisations and peoples’ roles and functioning within organisations20.
- To uncover behaviours or routines of which the observed themselves are not aware of20. What the researcher considers an important finding may belong to the self-evident nature of daily life from the participants’ point of view.
- To understand data collected through other methods (e.g. interviews) and also to design the right questions for those methods54.
3.2.3 What are the strengths and weaknesses of observations?
3.2.3.1 Strengths
A number of strenghts have already been described under “When to use observations?”. We could add that:
- Observation has the advantage of capturing data in more natural circumstances84.
- The Hawthorne effect[1] is an obvious drawback but once the initial stages of entering the field are past most professionals are too busy to maintain behaviour that is radically different from normal84
3.2.3.2 Weaknesses
- It can be very difficult to get access to the setting.
:An observer is often experienced as a threat, especially if the setting is not asking for the research to take place. Observation (and especially participant observation) might lead to knowledge of informal procedures or rules, which people do not want to be uncovered. Also the researcher can be experienced or perceived as a barrier for the normal daily routine in the setting10. In direct observation, the researcher does not participate in the setting, hence is known as a stranger and gets only access to the public or formal layer of the social reality. He does not become an insider and will miss inside information because he is too distant from the actors he is observing10. “Access, then, is not a straightforward process of speaking to the person in charge and obtaining the approval of the ethics committee. It usually involves considerable time and effort and a constant endeavour to strive for ‘cultural acceptability’ with the gatekeepers and participants in research sites” (p. 310)84. - Once inside the setting there is the problem of avoiding “going native”: This means “becoming so immersed in the group culture that the research agenda is lost or that it becomes extremely difficult or emotionally draining to exit the field and conclude the data collection” (p. 183)20.
- Observational data, are more than interview data, subject to interpretation by the researcher. Observers have a great degree of freedom and autonomy regarding what they choose to observe and how they filter the information84.
- Observations are time-consuming and hard work at every possible hour of the day.
- An observer can get emotionally involved in what he observes, and by consequence lose his neutrality.
- It is impossible to write down everything that is important while observing (and participating). The researcher must rely on his memory and have the discipline to write down and expand the field notes soon and as completely as possible54.
[1] The Hawthorne effect is the process where human subjects of an experiment change their behavior, simply because they are being studied http://www.experiment-resources.com/hawthorne-effect.html.
3.2.4 How to plan the research design?
Often observations are carried out at the beginning of the data collection phase, but the method can also be used later on during the research process to address questions suggested by data collected though other methods (Mack, 2005). Before starting the observations, the researcher should try to find out as much as possible about the site where he will be observing.
At the KCE, site visits are common to allow the researchers to become familiar with the research topic and setting. This is often combined with interviews or less formalized talks to key persons on the site. After a number of site visits the scope of the research project is determined and precise research questions are formulated.
3.2.5 Modalities of data collection
3.2.5.1 Participant versus direct observation
The role to adopt during observation and the extent to which participants are fully informed are somewhat intertwined84. Typically researchers refer to Gold’s typology of research roles85:
- The complete observer, who maintains some distance, does not interact and whose role is concealed;
- The observer as participant, who undertakes intermittent observation alongside interviewing, but whose role is known;
- The participant as observer, who undertakes prolonged observation, is involved in all the central activities of the organization and whose role is known;
- The complete participant, who interacts within the social situation, but again whose role is concealed.
Mack et al.54 describe observing as remaining an “outsider” and simply observing and documenting events or behaviors being studied, while participating is taking part in the activity while also documenting it. Pure observing, without participating is a situations that in fact seldom occurs, because once you are present, you are visible, you influence the activities around you, you participate in some degree. There are two reasons for this participation, or to better understand the local perspective, or in order not to call attention to yourself54.
3.2.5.2 Structured versus unstructured observation
- Structured observations are associated with the positivist paradigm and aim at recording physical and verbal behavior by means of a list of predetermined behaviours84.
- Unstructured observations are not ‘unstructured’ in the sense of unsystematic or messy, “instead, observers using unstructured methods usually enter ‘the field’ with no predetermined notions as to the discrete behaviours that they might observe. They may have some ideas as to what to observe, but these may change over time as they gather data and gain experience in the particular setting. Moreover, in unstructured observation the researcher may adopt a number of roles from complete participant to complete observer, whereas in structured observation the intention is always to ‘stand apart’ from that which is being observed” (p307)84.
3.2.5.3 Overt versus covert observation
Covert observation corresponds to two roles in Gold’s typology85, i.e. complete observer and complete participant (see above). Most authors agree that covert observation is only legitimate in very specific circumstances and should be avoided. Mack et al. 54 formulate the following ethical guideline regarding observations: “When conducting participant observation, you should be discreet enough about who you are and what you are doing that you do not disrupt normal activity, yet open enough that the people you observe and interact with do not feel that your presence compromises their privacy.”(p. 16) As with all qualitative research methods, researchers must also protect the identities of the people they observe or with whom they interact, even if informally. “Maintaining confidentiality means ensuring that particual individuals can never be linked to the data they provide”54.
3.2.6 Data collection tools
3.2.6.1 Checklists
Before you enter the setting and start observing, it might be a good idea to have some questions in mind. It may be helpful to carry a checklist in your pocket to help you remember what you are meant to observe54.
3.2.6.2 Fieldnotes
“Fieldnotes are used by researchers to record observations and fragments of remembered speech. Although researchers may use other means of recording (such as video) and other form s of data (such as interview transcripts), fieldnotes remain one of the primary analytic materials used in ethnography.” (p. 82) 35.
Depending on the research questions, the researcher is interested in other aspects of social reality. Mulhalls’ schema84 includes the following types of field notes, each covering an aspect of social reality:
- Structural and organizational features – what the actual buildings and environment look like and how they are used
- People – how they behave, interact, dress, move.
- The daily process of activities.
- Special events – in a hospital ward this might be the consultant’s round or the multidisciplinary team meeting.
- Dialogue.
- An everyday diary of events as they occur chronologically – both in the field and before entering the field.
- A personal/reflective diary – this includes both my thoughts about going into the field and being there, and reflections on my own life experiences that might influence the way in which I filter what I observe.
It is particularly important to detail any contradictory or negative cases. Unusual things often reveal most about the setting or situation20.
Documenting observations consists of the following steps54, 86:
- Quick notes during the observation.
, - Once the researcher left the setting, he expands his notes into fieldnotes. This means he reads them through and adds other things he can remember, but has not yet written down. Note taking in the setting is not self-evident and it is impossible to write down everything you see. Therefore good note taking should trigger the memory by means of key words, symbols, drawings, etc.
- After expansion, the researcher “translates” his shorthand into sentences.
, and - Together with the translation phase, a descriptive narrative can be composed. The researcher writes down a description of what happened and what he has learned about the setting. In this step the researcher should distinguish between describing what happened and interpreting.
The researcher should be well aware of the difference between describing what he observes versus interpreting what he observed. It should be avoided to report interpretations rather than an objective account of the observations54. For example, an interpretive description of a patient could be “he was in terrible pain”. An objective description would be “he was screaming and his face turned pale while grimacing”. “To interpret is to impose your own judgment on what you see” (Mack, 200554, p23). The danger is that interpretations can turn out to be wrong. Therefore the researcher should ask her/himself “what is my evidence for this claim?”54. One way of separating descriptions and interpretations is by separating them visually on paper or screen.
3.2.6.3 Draw a map of the setting or settings you observe.
Maps might support your memory and are a tool to reconstruct interactions and movements of people in a room.
3.2.6.4 Audio or video
Audio or video recordings of observations are generally not permissible unless all ethical requirements are fulfilled and informed consent has been obtained.
3.2.7 Sampling
As outlined in the general principles of the chapter on interviewing, sampling in qualitative research is seldom statistically based. Also samples of settings or groups to observe are purposive.
Specifically for observation the sampling units are places, locations, and blocks of time, but usually not individuals. The aim is to select ‘information-rich’ cases, but in practice site selection is often a pragmatic decision based on existing networks and accessibility. Ideally however, sites are chosen because they typify some larger population of sites (such as clinics) or perhaps because they are exceptional in some way. Observation methods may be used across multiple sites and one could select the ones representing a range of typical settings (Green et al, 2009).
3.2.8 Human resources necessary
Observations can be the work of one researcher, a pair of researcher, or a whole team. Which arrangement is most appropriate depends on the research questions and the features of the setting. Also members of a team can disperse to different locations individually, or in pairs or groups, in order to construct a more complete picture of the issues being studied.
One of the advantages of team work is that field notes can be compared and that team members can question each other about assertions being made. “Taking another perspective on validity Graneheim et al. (2001) used multiple data collectors with different perspectives (insider or outsider) to observe the same situation. This may not accord with the idea that every researcher may produce a unique account of a situation that is valid in its own right. But with extensive mutual reflection, as undertaken by Graneheim and colleagues, these combined observations may have consensual validity. However, from a practical standpoint few projects are afforded the luxury of multiple data collectors.” (Mulhall, 200384, p. 309).
3.2.9 Practical aspects
- Try to be “invisible” as an observator. Adapt to the setting in which you will do the observations, in terms of dress code, the way of behaving, and what is expected from you by the other actors in the setting.
- Start with short observations to explore the field and to get yourself used to your role as observer.
- First you should get an idea of “the normal” way of life in a setting, before you are able to identify unusual or abnormal situations.
- Circumstances may make it difficult or unacceptable to make fieldnotes, hence the researcher has to write down his observations afterwards. This can lead to a memory bias.
- Field notes should not contain interpretations, but merely descriptions.
- There is also the practical problem of how, especially in large and busy social settings, like an emergency department, to inform and obtain consent from everyone who might ‘enter’ the field of observation84.
- Note that once inside the setting it might be difficult to get out again: Ending the fieldwork should not happen abruptly. The researcher must take time to “ease out”. In the ‘easing out’ phase the researcher is more and more absent from the setting. This means more time to analyse the data. When present in the setting, the researcher can confront his preliminary analysis with new observations in the setting10. In the literature the advice is to keep in contact with the setting until the final report is written87.
3.2.10 Analysis
Field notes contain a lot of detail and are highly descriptive. In order to find explanations or answers to the research questions, the researcher should develop categories and test them against hypotheses, and refine them. This is an iterative process that starts during the data collection phase.
3.2.11 Reporting of findings
As with other qualitative research methods it is important that evidence from the data is presented to support the conclusions of the researcher, by means of examples or quotations. The main principles have already been mentioned in (see “How to report qualitative research findings”).
3.2.12 Quality criteria
The quality of observational studies depends largely on the quality of the descriptions of data collection and analysis provided by the researcher. Details about how the research was conducted are crucial and should be well documented. For example, how much time was spent in the field, how typical were the events recorded, description of the attempts to verify the observations made, etc.
The general criteria to assess the quality of qualitative research are described here and also apply to observational methods.
3.2.13 Examples of KCE reports using the method
So far no observational studies have been carried out at the KCE.
3.3 Delphi Technique
Consensus reaching methods generally used in health care are Delphi panel, nominal group or consensus conference. They are useful to organize “qualitative judgments and, which is concerned to understand the meanings that people use when making decisions about health care.” (Black, 200688, page 132). They are not as such qualitative methods because they may use quantitative data collection tools (questionnaires, scales), and quantitative element in the analysis (statistics).
All the consensus methods cited here are characterized by the provision of information prior to the discussion, privacy (participants express their opinion in private), opportunity for participants to change their view and explicit and transparent derivation of the group decision, based on (statistical) analysis88.
3.3.1 Description of the method
The Delphi method (named so because of the Delphi Oracle) was initiated by the RAND corporation, a nonprofit institution that helps improve policy and decision making through research and analysis[a]. The original definition given in the 50s was that it “entails a group of experts who anonymously reply to questionnaires and subsequently receive feedback in the form of a statistical representation of the "group response," after which the process repeats itself. The goal is to reduce the range of responses and arrive at something closer to expert consensus.”89 Today, the method has evolved and Delphi surveys could aim at different goals or have several designs[b]. It could be define more as “a method for structuring a group communication process” and not as a method to produce consensus90. The method could also be defined as a systematic collection and aggregation tool of informed judgment from a group of experts on specific questions and issues” (Hasson, 201191, p. 1696).
Delphi surveys are used in several domains (politics, psychology, agriculture, etc.) and could vary in different ways. Several types of Delphi often used in health research (non exhaustive) are presented in Table 10.
Table 10 – Types of Delphi designs
|
Design Type |
Aim |
Target panellists |
Administration |
Number of rounds |
Round 1 design |
|
Classical |
To elicit opinion and gain consensus |
Experts selected based on aims of research |
Traditionally postal |
Employs three or more rounds[3] |
Open qualitative first round, to allow panelists to record responses |
|
Modified |
Aim varies according to project design, from predicting future events to achieving consensus |
Experts selected based on aims of research |
Varies, postal, online, etc. |
May employ fewer than 3 rounds |
Panelists provided with pre-selected items, drawn from various sources, within which they are asked to consider their responses |
|
Decision |
To structure decision-making and create the future in reality rather than predicting it |
Decision makers, selected according to hierarchical position and level of expertise |
Varies |
Varies |
Can adopt similar process to classical Delphi |
|
Policy |
To generate opposing views on policy and potential resolutions |
Policy makers selected to obtain divergent opinions |
Can adopt a number of formats including bringing participants together in a group meeting |
Varies |
Can adopt similar process to classical Delphi or 1- preformulating the obvious issues by the research team; |
|
Real time/consensus conference |
To elicit opinion and gain consensus on real time |
Experts selected based on aims of research |
Use of computer technology that panelists use in the same room to achieve consensus in real time rather than post or via Internet94 |
Varies |
Can adopt similar process |
Adapted from Hasson, 201191, p. 1697 and Keeney, 201195
[b] See the special issue 78 of the review ‘Technological Forecasting & Social change” (2011) available at http://www.journals.elsevier.com/technological-forecasting-and-social-ch....
[3] Note that the number of rounds should ideally be based on the saturation of the responses and is difficult to fix in advance
3.3.2 Specific questions suitable for the method
The following questions could be answered by using a consensus reaching method such as the Delphi panel:
- To help the decision making process.
- When personal contact is not necessary96.
- To choose the most appropriate method or tool (e.g. data collection technique, scales, questionnaires, etc.).
- To identify the best choice of treatment (when no other evidence is available or to complete it).
- To identify the form of a programme.
- To clarify professional roles97.
- To develop clinical guidelines98.
3.3.3 Strengths and weaknesses of the method
3.3.3.1 Strengths
- Lower production cost99.
- Relatively rapid results99.
- Participant can express their opinion anonymously96, without external (perceived) pressure while the process allows to catch the view of the entire group96.
- Avoid domination by individuals or professional interests97;
3.3.3.2 Weaknesses
- Success depends on the qualities of the participants.
- Reliability increases with the number of participants (and the number of rounds). In addition, it is difficult to keep everybody in successive rounds96.
- Coordination is difficult96.
- The existence of a consensus does not necessary mean that it reflects an appropriate or “correct” answer97.
3.3.4 How to plan the research design?
A Delphi survey takes several weeks, even if the number of participants is small.
It has to be planned in the beginning of the project or, if the necessity to conduct such a study appears late in the course of the project, it is important to realize that the whole process takes several weeks, depending on the number of rounds needed. The next figure illustrates the whole process and the time needed.
Figure 5 – The Delphi process
Adapted from Slocum et al.93
3.3.5 Modalities of data collection
Delphi could be administrated ‘paper-and-pencil’ by mail or e-mail.
Online Delphi’s are more and more carried out. Software is available to support the data collection and the analysis (Delphi_Survey_Web (DSW)100, Mesydel©101)
The number of rounds is not necessarily defined a priori (often because of budgetary, time or human resources limitations): data collection must stop when the saturation or the consensus is reached.
3.3.6 Data collection tools
The Delphi method uses iterative (e-)mailed questionnaires in successive rounds. Because there is no interaction between the respondent and the researcher, the formulation of the questions has to be clear, and definitions should be given where necessary.
The questionnaire of the first round encompasses open-ended questions, to identify items to include in the second round.
Next rounds could be exclusively qualitative or composed of closed questions with scales (from totally agree to totally disagree, i.e. from 1 to 9), or combining both qualitative and quantitative questions. They present a synthesis of the results issued from the previous round.
In the case of closed questions, agreement is usually summarized by using the median and consensus assessed by presenting interquartile ranges for continuous numerical scales97. Graphical presentations of the results are welcomed.
In KCE reports the questionnaires used in each round are presented in appendices.
3.3.7 Sampling
Participants have to be carefully chosen because of their expertise, experience or knowledge in the field of the research question. In addition, the variety of positions in the field or opinions regarding the subject, should be covered. In that way, lay people could be added to increase the variety of viewpoints102.
They could be identified through publically available bibliographic information102. Snowballing recruitment could be useful to secure easy agreement to panelist invitation and strengthen panelist retention102.
There is no practical limit to the number of participants in a Delphi survey89.
3.3.8 Human resources necessary
The administrator of the survey develops the questionnaires, identifies, mobilizes and recruits participants, analyses findings and reports them. He/she is responsible for keeping a low attrition rate and insure the coherence between the different steps of the method.
Administrative support could be needed to (e-)mail the questionnaires and manage reminders and answers.
3.3.9 Practical aspects
- It is important to clearly explain the goal of the questionnaire and the way it will be analysed. The redaction of the invitation/introduction letter is thus crucial. “Stressing the practical policy application of the Delphi yield to experts panelists to aid their retention” (Rowe, 2011102, p. 1489).
- The research team should have managers skills to follow up the returned questionnaires and mailing.
- The utilization of online tools could be very useful as well for the research team (rapid results) as for the participants.
- While anonymity in the process of the Delphi is required, “using social rewards for recognition in participation, such as subsequently publishing panel membership listings” (Rowe, 2001102, p. 1489) could improve panelists recruitment and retention.
3.3.10 Analysis
Each step of the Delphi requires a specific analysis.
In a classical Delphi, open-ended questions from round 1 should be content analysed ‘in order to group statements generated by the experts panel into similar areas’95.
Round that uses closed questions should be statistically analysed. Summary statistics are used to decide whether or not consensus is reached. The level of the consensus has to be defined in advance (i.e. 70% of agreement).
There is no agreement on the threshold indicating a consensus, nor how to choose this threshold95. Each researcher has to reflect on it, case by case.
The proposals that have reached consensus should be eliminated from the next round.
3.3.11 Reporting of findings
Intermediary results are reported directly in the successive questionnaires.
All the consensus and dissensus items are listed and discussed at the end of the process.
3.3.12 Quality criteria
It seems that no consensus exists with regards to the standard of methodological rigor to apply. And that “no definitive evidence exists which demonstrates the reliability or validity of the technique” (Keeney, 201195, p. 104). This is partly due to the variety of the Delphi surveys and the constant evolutions in this field91.
We have not identified any checklists to assess the quality of a Delphi survey.
However, the following aspects of the survey could be assessed (adapted from Jillson103 and Hasson91):
- Applicability of the method to the specific research problem
- The quality of the composition of the Delphi panel. Participants have to be carefully chosen in function of their expertise and position in the group.
- Design and administration of the questionnaire
- Feedback
A Delphi survey should be reviewed in terms of reliability, validity and trustworthiness to judge its worth91.
3.1.13 Examples of KCE reports using the method
- Impact of academic detailing on primary care physicians104
- Burnout among general practitioners: prevention and management72
- Methods for including public preference values in reimbursement decision making processes for health interventions. Exploration of the feasibility of different models in Belgium (ongoing project, publication foreseen end 2012)
3.1.14 Basis references
For practical tips see the report of the King Baudouin Foundation available in French, Dutch and English93
4. How to analyse?
4.1. Aim of the qualitative data analysis
The aim of this process note is to give an overview and brief description of approaches useful for qualitative data analysis in the context of KCE projects. It will not provide one recipe, but rather a range of perspectives, ways of looking at the data. Depending on the research aim and questions some perspectives are more suited than others.
4.2. Definition
“Qualitative data analysis (QDA) is the range of processes and procedures whereby we move from the qualitative data that have been collected into some form of explanation, understanding or interpretation of the people and situations we are investigating”. (Lewins et al. 2010)
In general qualitative data analysis means moving from data to meanings or representations. Flick (Flick 2015) defines qualitative data analysis as follows:
“The classification and interpretation of linguistic (or visual) material to make statements about implicit and explicit dimensions and structures of meaning-making in the material and what is represented in it” (p. 5).
The aims of qualitative data analysis are multiple, for example:
- To describe a phenomenon in some or greater detail
- To compare several cases (individuals or groups) with focus on what they have in common or on the differences between them
- To explain a phenomenon or gain insight in a problematic situation
- To develop a theory of a phenomenon
There are several ways to analyze textual data. “Unlike quantitative analysis, there are no clear rules or procedures for qualitative data analysis, but many different possible approaches” (Spencer et al. 2014), p. 270). “Qualitative analysis transforms data into findings. No formula exists for that transformation. Guidance, yet. But no recipe.” (Patton 2002)
Alternative traditions vary in terms of basic epistemological assumptions about the nature of the inquiry and the status of the researcher, the main focus and aims of the analytic process (Spencer et al. 2014, p. 272). Generally speaking, the analysis process begins with the data management and end up with abstraction and interpretation, from organizing the data, describing them to explaining them (Spencer et al. 2014).
According to Spencer et al. (2014), the hallmarks of rigorous and well-founded substantive, cross-sectional qualitative data analysis are:
- Remaining grounded in the data
- Allowing systematic and comprehensive coverage of the data set
- Permitting within- and between-case searches
- Affording transparency to others
4.3. “Methods”, “traditions” and “approaches” in qualitative analysis
Many concepts and terms are used by qualitative researchers. They are not always standardized and we find it useful to clarify the ones we will use in this process note. This part is therefore not exhaustive. We are largely inspired by by Paillé and Mucchielli (Paillé and Mucchielli 2011) and translated their terminology.
4.3.1 Generic methods for analyzing
Globally, a generic method for analyzing is used in many situations: How to analyze the data? To get the meaning of the data? It encompasses the technical and intellectual operations and manipulations helping the researcher to catch the meanings.
- Technical operations for analyzing are processes, operations and management of the data such as transcriptions, cutting of the text, putting it in tables, etc.
- Intellectual operations for analyzing consist of the transposition of terms in other terms, intuitive groupings, confrontation, induction …
Classically, 3 generic methods of analysis are used in qualitative health (care) research, each of them using specific tools
- The phenomenological examination of the empirical data, aiming to report the authentic comprehension of the material
- The thematic analysis, more specifically this is the creation and the refinement of categories to give a global picture of the material
- The analysis using conceptualising categories, aiming at the creation and the refinement of categories to go further than the description, to reach conceptualization of
4.3.2 Specific traditions
Specific traditions are embedded in the generic methods used in health(care) research we described. We give an example for each of them:
4.1.1.1 Phenomenology
Phenomenology focuses on “how human beings make sense of experience and transform experience into consciousness, both individually and as shared meaning” (Patton 2015, p.115). Phenomenology is about understanding the nature or meaning of everyday life. In-depth interviews with people who have directly experienced the phenomenon of interest, is the most used data collection technique. Phenomenology in qualitative research goes back to a philosophical tradition that was first applied to social science by E. H. Husserl to study people’s daily experiences.
Phenomenology will not be developed into detail, because it is less relevant to KCE projects.
4.1.1.2 Framework analysis
Framework analysis has been developed specifically for applied or policy relevant qualitative research, and is a deductive research strategy. In a framework analysis the objectives of the investigation are set in advance. The thematic framework for the content analysis is identified before the research or the qualitative research part in the project sets off.
The decision on using frameworks when analyzing data is closely related to the question for what purpose the qualitative material will be used in the overall research strategy. “Frameworks” are generally deducted from hypotheses of theoretical frameworks: e.g. if the aim of a focus group is trying to get a picture of stakeholders interests and potential conflicting perspectives on a health care issue, and the focus group tries to grasp how stakeholders develop power plays or influence strategies to set agenda’s, a conceptual framework on decision-making processes and power play will serve as a useful tool to orient data-collection and data-analysis.
Applying framework analysis concretely means that the themes emerging from the data are placed in the framework defined a priori. The framework is systematically applied to all the data. Although an analytical framework can be very useful, it is not suited, if the aim is to discover new ideas, since a framework or grid could be blinding (Paillé and Mucchielli 2011).
For the specificity of the analysis of data according to this method see Framework analysis
4.1.1.3 Grounded theory
Grounded theory was developed by Glaser and Strauss in the late 1960s as a methodology for extracting meaning from qualitative data. Typically, the researcher does not start from a preconceived theory, but allows the theory to emerge from the data (Durant-Law 2005). Hence grounded theory is an inductive rather than a deductive methodology. Emergence is also a key assumption in grounded theory: data, information and knowledge are seen as emergent phenomena that are actively constructed. They can only have meaning when positioned in time, space and culture (Durant-Law 2005).
The power of grounded theory lies in the depth of the analysis. Grounded theory explains rather than describes and aims at a deep understanding of phenomena (Durant-Law 2005). Key to grounded theory is the emphasis on theory as the final output of research. Other approaches may stop at the level of description or interpretation of the data (e.g. thematic analysis).
Grounded theory is a complete method, a way of conceptualizing a qualitative research project.
For the specificity of the analysis of data according to this method see Data analysis in the Grounded Theory
4.3.3 Inductive versus deductive approaches
The approach chosen depends largely on the design and the aims of the research. Some designs and/or research questions require an inductive, others a deductive approach. Inductive means that themes emerge from the data, while deductive implies a pre-existing theory or framework which is applied to the data. Qualitative data analysis tends to be inductive, which means that the researcher identifies categories in the data, without predefined hypotheses. However, this is not always the case. A qualitative research analysis can also be top down, with predefined categories to which the data are coded, for example a priori concepts can be adopted from the literature or a relevant field. Framework analysis can be used this way.
The next table shows how the different methods, approaches and types of coding relate to each other.
Generic methods, specific methods/ traditions, approaches and type of coding for qualitative analysis
|
Generic methods |
|||
|
Phenomenological examination of the empirical data |
Phenomenology |
Inductive |
Statements |
|
Thematic analysis |
Descriptive analysis Framework analysis |
Mainly deductive Mainly deductive |
Themes |
|
Analysis using conceptualizing categories |
Grounded Theory
|
Mainly inductive Mainly deductive |
Conceptualizing categories |
4.4. The analytic journey
As in any research method, analyzing collected data is a necessary step in order to draw conclusions. Analyzing qualitative data is not a simple nor a quick task. Done properly, it is systematic and rigorous, and therefore labor-intensive and time-consuming “[…] good qualitative analysis is able to document its claim to reflect some of the truth of a phenomenon by reference to systematically gathered data” (Fielding 1993), in contrast “poor qualitative analysis is anecdotal, unreflective, descriptive without being focused on a coherent line of inquiry.” (Fielding 1993) (Pope et al. 2000, p. 116). Qualitative analysis is a matter of deconstructing the data, in order to construct an analysis or theory (Mortelmans 2009).
The ways and techniques to analyze qualitative data are not easy to describe as it requires a lot of “fingerspitzengefühl” and it is unrealistic to expect a kind of recipe book which can be followed in order to produce a good analysis. Therefore what we present here is a number of hands-on guidelines, which have proven useful to others.
The difficulty of qualitative analysis lies in the lack of standardization and the absence of a universal set of clear-cut procedures which fit every type of data and could be almost automatically applied. Also there are several methods/approaches/traditions for taking the analysis forward (see table). These move from inductive to more deductive, but in practice the researcher often moves back- and forward between the data and the emerging interpretations. Hence induction and deduction are often used in the same analysis. Also elements from different approaches may be combined in one analysis (Pope and Mays 2006).
Different aims may also require different depths of analysis. Research can aim to describe the phenomena being studied, or go on to develop explanations for the patterns observed in the data, or use the data to construct a more general theory (Spencer et al. 2014). Initial coding of the data is usually descriptive, staying close to the data, whereas labels developed later in the analytic process are more abstract concepts (Spencer et al. 2014).
“The analysis may seek simply to describe people’s views or behaviors, or move beyond this to provide explanation that can take the form of classifications, typologies, patterns, models and theories (Pope and Mays 2006, p. 67).”
The two levels of analysis can be described as following:
- The basic level is a descriptive account of what was said (by whom) related to particular topics and questions. Some texts refer to this as the “manifest level” or type of analysis.
- The higher level of analysis is interpretative: this is the level of identifying the “meanings”. It is sometimes called the latent level of analysis. This second level of analysis can to a large degree be inspired by theories.
The selected approach is part of the research design, hence chosen at the beginning of the research process.
In what follows we describe a generic theoretic process for qualitative data analysis.
Figure: Conceptual representation of the analytic journey of qualitative data with an inductive approach
Each theoretical approach adds its own typical emphases. The most relevant approaches are described in next section. These steps could also be useful in the processing of qualitative data following a system thinking method [ADD crossrefs].
Step 0: Preparing the data for analysis
Independent of the methodological approach, a qualitative analysis always starts with the preparation of the gathered data. Ideally, to enable accurate data analysis the recorded information is transcribed. A transcript is the full length literal text of the interview. It often produces a lot of written text.
Good quality transcribing is not simply transferring words from the tape to the page. The wording is only part of the message. A lot of additional information is to be found in the way people speak. Tone and inflection, timing of reactions are important indicators too. With experienced observers and note-takers, a thematic analysis of the notes taken during the interviews could be used as a basis for analysis of the “non-verbal” communication.
Transcribing is time consuming and costly. The research team should consider in advance the question "who should do the transcribing”? Resources may be needed to pay an audio typist, a strategy usually more cost effective than a researcher. Be aware that “typists” are often unfamiliar with the terminology or language used in the interviews or focus groups which can lead to mistakes and/or prolong the transcribing time.
It may not be essential to transcribe every interview or focus group. It is possible to use a technique known as tape and notebook analysis, which means taking notes from a playback of the tape recorded interview and triangulating them with the notes taken by the observers and note-takers. However, bias can occur if inexperienced qualitative researchers attempt tape and notebook analysis. It is certainly preferable to produce full transcripts of the first few interviews. Once the researcher becomes familiar with the key messages emerging from the data tape analysis may be possible. Transcripts are especially valuable when several researchers work with the same data.
Step 1: Familiarization
Researchers immerse themselves in the data (interview transcripts and/or field notes), mostly by reading through the transcripts, gaining an overview of the substantive content and identifying topics of interest (Spencer et al, 2014). Doing this, they get familiar with the data.
Step 2: Coding the data - Construction of initial categories
By reading and re-reading the data in order to develop a profound knowledge of the data, an initial set of labels is identified. This step is very laborious (especially with large amounts of data). Pieces of text are coded, i.e. given a label or a name. Generally, in the qualitative analysis literature, “ data coding” refers to this data management. However data coding refers to different levels of analysis.
Here are some commonly used terms (Paillé and Muchielli, 2011):
Label:
Labeling a text or part of a text is the identification of the topic of the extract, not what is said about it. “What is the extract about?” The labels allow to make a first classification of the documents/ extracts. They are useful in a first quick reading of the corpus.
Example: “Familial difficulties”
Code:
The code is the numerical/truncated form of the label. This tool is not very useful in qualitative data analysis.
Example: “Fam.Diff.”
Theme:
The theme goes further than the label. It requires a more attentive lecture.
“What is the topic more precisely?”
Example: “Difficulties to care for children”
Statement:
Statements are short extracts, short syntheses of the content of the extract. “What is the key message of what is said?”, “What is told?”
The statement is more precise than the theme because it resumes, reformulates or synthetizes the extract. They are mainly used in phenomenology.
Example: The respondent tells that she has financial difficulties because she has to spend time and money to take care of her children.
Conceptualizing category:
Conceptualizing categories are the substantive designations of phenomena occurring in the extract of the analyzed corpus. Hence, this approaches theory construction.
Example: “Parental overload”
These types of coding terms are generally more specific to certain types of qualitative data analysis methods (Paillé and Muchielli, 2011).
By coding qualitative data, meanings are isolated in function of answering the research question. One piece of text may belong to more than one category or label. Hence there is likely to be overlap between categories. Major attention should be paid to “rival explanations” or interpretations about the data.
For further detailed information on coding qualitative data:
Saldaña J. The coding manual for qualitative researchers. 2nd edition ed. London: Sage Publications; 2013.
Step 3: Refine and regroup categories
In a third step the categories are further refined and reduced by being grouped together. “While reading through extracts of the data that have been labelled in a particular way, the researchers assesses the coherence of the data to see whether they are indeed ‘about the same thing’ and whether labels need to be amended and reapplied to the data” (Spencer et al. 2014a), p. 282).
Word processors or software for qualitative data analysis [LAK1] will prove to be very helpful at this stage.
[LAK1]Add crosslink vers section process book existante
Step 4: Constant comparison
During the analysis the researcher might (as a third step) constantly compare the constructed categories with new data, and the new categories with already analyzed data. This results in a kind of inductive cycle of constant comparison to fine tune categories and concepts arising from the data. NB: In the particular case of focus groups, separate analyses have to be performed on data gathered “within-focus group” and continuously compared “between focus group”. This is also an iterative process.
(Step 5): New data collection
New data collection could also be necessary to verify new point of views or insights emerging from the analysis.
Before moving to the more interpretive stage of analysis, the researchers may decide to write a description for each subtheme in the study (Spencer et al., 2014).
Step 6: Abstraction and interpretation
“Taking each theme in turn, the researcher reviews all the relevant data extracts or summaries, mapping the range and diversity of views and experiences, identifying constituent elements and underlying dimensions, and proposing key themes or concepts that underpin them. The process of categorization typically involves moving from surface features of the data to more analytic properties. Researchers may proceed through several iterations, comparing and combining the data at higher levels of abstraction to create more analytic concepts or themes, each of which may be divided into a set of categories. Where appropriate, categories may be further refined and combined into more abstract classes. Dey (1993) uses the term ‘splitting’ and ‘slicing’ to describe the way ideas are broken down and then recombined at a higher level – whereas splitting gives greater precision and detail, slicing achieves greater integration and scope. In this way, more descriptive themes used at the data management stage may well undergo a major transformation to form part of a new, more abstract categorical or classificatory system” (Spencer et al., 2014, p. 285). At this stage typologies can be created.
Step 7: Description of the findings and reporting
Findings can be presented in a number of ways, there is no specific format to follow.
When writing up findings issued from interviews or texts qualitative researchers often use quotes. Quotes are useful in order to (Corden and Roy 2006):
- Illustrate the themes emerging from the analysis.
- Provide evidence for interpretations, comparable to the use of tables of statistical data appearing in reports based on quantitative findings.
- Strengthen credibility of the findings (despites critics argue that researchers can always find at least one quote to support any point they might with to make).
- Deepen understanding. The actual words of a respondent could sometimes be a better representation of the depth of feeling.
- Enable voice to research participants. This enables participants to speak for themselves and is especially relevant in a participatory paradigm.
- Enhance readability by providing some vividness and sometimes humour: Braking up long passages of text by inserting spoken words, could help to keep the reader focused, but there could be a danger in moving too far towards a journalistic approach.
Ideally, quotes are anonymous and are accompanied by a pseudonym or description of the respondents. For example, in a research about normal birth, this could be: (Midwife, 36 years). There are however exceptions the rule of anonymity, e.g. stakeholder interviews, in which the identity of the respondent is important for the interpretation of the findings. In that case the respondent should self-evidently be informed and his agreement is needed in order to proceed.
Also in terms of lay out quotations should be different from the rest of the text, for example by using indents, italic fond or quotation marks. Quotes are used to strengthen the argument, but should be used sparingly and in function of the findings. Try to choose citations in a way that all respondents are represented. Be aware that readers might give more weight to themes illustrated with a quotation.
When the research is conducted in another language than the language of the report in which the findings are presented, quotes are most often translated. “As translation is also an interpretive act, meaning may get lost in the translation process (van Nes et al.), p. 313)”. It is recommended to stay in the original language as long and as much as possible and delay the use of translations to the stage of writing up the findings (van Nes et al.).
KCE practice is to translate quotes only for publications in international scientific journals, but not for KCE reports. Although KCE reports are written in English, inserted quotes are in Dutch or French to stay close to the original meaning. The authors should pay attention to the readability of the text and make sure that the text without quotes is comprehensive to English speaking readers.
So far, this general a-theoretic procedure reflects what in the literature is called the general inductive approach for analyzing qualitative data. It does not aim at the construction of theories, but the mere description of emerging themes. It provides a simple, straightforward approach for deriving findings in the context of focused research questions without having to learn an underlying philosophy or technical language associated with other qualitative analysis approaches (Thomas, 2006).
4.5. Three ways to analyse qualitative data
4.5.1 An analysis with (predefined) themes: a deductive approach
Adapted from Paillé and Muchielli , 2011.
The thematic analysis is a process to reduce data. It is not a deep analysis, but rather to describe the topic(s) appearing in the corpus. “Thematization” is a preliminary step in all types of analysis of qualitative data. It consists of transposing the corpus into a number of themes issued from the analyzed content and according to the problematic.
A first step is the location, i.e. the listing of all the themes pertinent for the research question. The second step is to document it: identify the importance of specific themes, repetitions, crosschecks, what goes together, what goes opposite…
What is a theme?
Adapted from Paillé and Muchielli , 2011.
In a thematic analysis, the analyst will search to identify and organize themes in the corpus. We will call this process the ‘Thematization’ of the corpus. This is a set of words aiming to identify what is covered in the corresponding extract of the corpus text, while providing guidance on the substance of what is said. The extract of the text is called ‘a unit of signification’, i.e. sentence(s) linked to a similar idea, topic or theme. Inference is the transformation of the unit of signification to themes.
How to define and assign pertinent themes?
Adapted from Paillé and Muchielli , 2011.
The definition of the themes depends on the framework of the research and the expected level of generality or inference.
Indeed, the analysis will be carried out in a specific framework, i.e. the aim of the research, and with a certain orientation and some presuppositions. These are directly linked to the data collection and the position of the analyst.
The definition of the themes will depend on the data collection:
Once a researcher is ready to launch the Thematization, (s)he has already done many steps: (s)he has defined the problem(s), focused the study, defined objectives, prepared the data collection, written the interview guide, has interacted with participants and perhaps reoriented or redefined new avenues for the research. Many sources have thus already oriented the work and should be highlighted and explained once again before the start of the analysis. For example, Thematization will not be the same if you search for “representations” than if you search for “strategies”, if you analyze psychological responses or social environment, etc.
The definition of the themes will depend on the position of the researcher
Each analyst has some theoretical background, due to his/her training, previous researches, theoretical knowledge, etc. These elements will influence the way they will read, analyze and therefore chose themes to be applied to the corpus. On one hand, (s)he will have a certain level of sensibility that will increase throughout readings, experience of research and reasoning. This level will also improve during the analysis of the corpus itself. On the other hand, s(he) will improve his/her theoretical capacities with new concepts, models, etc.
To process to the analysis, it is important to clearly delimited the theme and label it with a precise formulation. It is easier to begin with a low level of inference, i.e. to be as close as possible of the text or the interview but not to reproduce the verbatim. Interpretation, theorization or making the essence of an experience emerging are not the objectives of a thematic analysis. It is a list and a synthesis of the relevant themes appearing in a corpus.
The risk to end with different themes according to different analyst is not excluded at all and even natural and foreseeable. However it will be limited if everyone adopt the same position with the same goal, i.e. Thematization, and nothing else.
The inference will be done following the next reasoning: because the presence of this or this element or indication in the extract, it is possible to assign it the theme “X”. It is not because a theme appears only once that it is not important.
The thematic tree
The thematic analysis will build a thematic tree.
It is a synthetic and structured representation of the analyzed content. Themes are regrouped in main themes subdivided by subsidiary themes and sub-themes in a schematic way.
Technical aspects in the coding
Adapted from Paillé and Muchielli , 2011.
In order to process a thematic analysis, technical choices should be done:
a) The nature of the support : paper or (specialized) software [see further ADD CROSSREF]
b) The mode of the annotation of the themes (linked to the choice of the software):
Here are the commonly used:
- Annotation in the margin
- Annotation inserted (up to the extract/ color code)
- Annotations on files one per theme where the source (e.g. interview A) and the extract (e.g. line 12-29) are written. There is thus no annotation in the text.
The best choice for the type of annotation is very personnal. One should aim to combine ease of use and efficacy.
c) The type of treatment: continuously or sequential.
- The continuous Thematization:
Themes are given as the reading of the text and the thematic tree is built in parallel progressively, with fusion, regrouping, hierarchical classification…until a final tree at the end of the research. This process offer an accurate and rich analysis. But it is complex and time expensive. It is more adapted for a small corpus and more personnalized Thematization. - The sequential Thematization:
The analysis is more hypotetico-deductive and is done in two steps:
1) Themes are elaborated based on a sample of the corpus and listed. To each theme correspond a clear definition. A hierarchy could already be proposed or not
2) The list is then strictly applied to the whole corpus, with the possibility to add a limited number of new themes.
This type of analysis is more effective but goes less in depth. It is however more appropriate for an analysis in team.
To go further in the practical aspect of thematic analysis
Paillé P, Mucchielli A. L'analyse qualitative en sciences humaines et sociales. 2ème ed. Paris: Armand Colin; 2011.
4.5.2 Framework analysis
Adapted from Spencer L, Ritchie J, O'connor W, G. M, Ormston R. Analysis in practice. In: Ritchie J, Lewis J, McNaughton Nicholls C, Ormston R, editors. Qualitative research practice. London: Natcen, Sage; 2014. p. 295-345.
In the framework analysis data will be sifted, charted and sorted in accordance with key issues and themes (Srivastava et al. 2009). The analytical journey using this approach could be simply described as:
- Familiarization
- Constructing the initial framework
- Indexing
- Charting
- Abstraction and interpretation
The familiarization is the same as explained previously [add crossref]. In this approach, it is the occasion to identify topics or issues of interest, recurrent across the data and relevant for the research question, taking thus into account the aims of the study and the subjects contained in the topic guide.
The construction of an initial thematic framework can begin once the list of topics has been reviewed. This step aims to organize the data. The analyst will identify underlying ideas or themes related to particular items. (s)He will use these to group and sort the items according to different levels of generality, building a hierarchical arrangement of themes and subthemes. It results in a sort of table of content of what could be found in the corpus. These themes or issues “may have arisen from a priori themes (…) however it is at this stage that the researcher must allow the data to dictate the themes and issues”. “Although the researcher may have a set of a priori issues, it is important to maintain an open mind and not force the data to fit the a priori issues. However since the research was designed around a priori issues it is most likely that these issues will guide the thematic framework. Ritchie and Spencer stress that the thematic framework is only tentative and there are further chances of refining it at subsequent stages of analysis (1994).” (Srivastava et al. 2009, p.76).
The next step consists of indexing the data, i.e. labelling sections of the corpus according to the thematic framework. This could be done by annotation in the margin of the transcript.
The fourth stage consist of charting: the indexed data are arranged in charts of themes. One chart is built for each theme. Subthemes are headings of the columns while each row represent an interview, transcript or unit of analysis. The content of each cell is a summary of the section of the corpus related to the subtheme.
To write useful summaries, “the general principle should be to include enough details and context so that the analyst is not required to go back to the transcribed data to understand the point being made, but not include so much that the matrices become full of undigested material (…)”. (Spencer et al. 2014b, p 309)
Spencer et al identified 3 requirements essential in order to retain the essence of the original material (Spencer et al. 2014b, p 309).
- Key terms phrases or expressions should be taken as much as possible from the participant’s own language;
- Interpretation should be kept to a minimum at this stage;
- Material should not be dismissed as irrelevant just because its inclusion is not immediately clear.
The last step is the mapping and interpretation. Spencer et al. advice to take the time to do this, have a break, read through the management of the data, etc.
In this phase, concept, categories could be developed. Linkage between them could be described and explanations and patterns could be raised. This could even be performed by a theorizing deduction. The category is issued of a theoretical preexisting referent. The categories exist because a former analysis of the problematic has already been carried out. (Paillé and Muchielli. 2011). In the framework analysis, the main categorical analysis grid is preexisting. This could be because the research object is already well studied, because of the research is commissioned by an institution or because the research is spread through different teams in different locations (Paillé and Muchielli. 2011).
Nivivo [add cross ref] could be very helpful in the management of the data and creation of the matrix when using the Framework approach.
4.5.3 An analysis with conceptualizing categories: an inductive approach
Adapted from Paillé and Muchielli , 2011.
The analysis by conceptualizing categories allows a more in depth analysis. It is more than only the identification of themes, without a link between the annotation of the corpus and the conceptualizing of the data. It is more than a synthesis of the material. It includes an intention to analyze, to reach the meaning and use then a type of annotation reflecting the comprehension made by the analyst.
What is a category?
Adapted from Paillé and Muchielli , 2011.
A category is a textual production, under the form of a brief expression and allowing to name a phenomenon through a conceptual reading of the corpus. A category responds to “Given my problematic, what is this phenomenon?”, “how can I name this phenomenon conceptually?”
A category belongs to a set of categories, and makes sense in regarding the other categories. It is a matter of relationships between categories. A category is for the analyst an attempt to comprehend, while for the reader it is an access to the meaning. It encompasses the evocation of what is said but is also conceptually rich. It induces a precise mental image of a dynamic or a sequence of events.
The intellectual process of the categorization
Adapted from Paillé and Muchielli , 2011.
Three types of processes could be implied in the categorization: an analytic description, an interpretative deduction and a theorizing induction. But in practice these distinctions will progressively blur. The analytic description is a first step, closer to the text and is a preliminary descriptive work.
As for the thematic coding, it is important to search for the right level or the right context. Here also it depends on the position of the researcher and the context of the research.
For the technical aspects of the coding, we proposed to read and apply the considerations proposed for the thematic coding.
Data analysis in Grounded Theory
Key to grounded theory is the idea that the researcher builds theories from empirical data. Strauss and Corbin (Strauss and Corbin 1998) define theory as “a set of well-developed concepts related through statements of relationship, which together constitute an integrated framework that can be used to explain or predict phenomena” (p. 51). The aim is to produce general statements based on specific cases (analytic induction). Essential is that the insights emerge from the data. It is a theorizing induction process. Other core features are the cyclic approach and the constant comparison.
The cyclic approach is already apparent during data collection, but also in data analysis. Data collection is followed by preliminary data analysis, which is followed by new data collection etc. After each analytic phase, the topic list is adapted and information is collected in a more directed way. The researcher tries to fill in blind spots in his analysis and the testing of hypotheses. Hence, data analysis is generally expected to be an iterative process. Especially in the grounded theory approach constant comparative analysis is emphasized. This means that overall data collection and data-analysis are not organized in a strict sequential way. Constant comparative analysis is a process whereby data collection and data analysis occur on an ongoing basis. The interview is transcribed and analyzed as soon as possible, preferably before the next interview takes place. Any interesting finding is documented and incorporated into the next interview. The process is repeated with each interview until saturation is reached. As a result it could be possible that the initial interviews in a research project differ a lot from the later interviews as the interview schedule is continuously adapted and revised. For this reason researchers have to clarify and document on how structured or unstructured their data-collection method is and keep memos of the process. Notes and observations made at the time of the interview are re-examined, challenged, amended, and/or confirmed using transcribed audio or video tapes. One expects that all members of the research team participate in a review of the final interpretation, in which data and analysis are again re-examined, analyzed, evaluated, and confirmed. The use of more than one analyst can improve the consistency or reliability of analyses.
Within the analysis the cyclic character is also evident from the constant comparison: the researcher tries to falsify his findings through the integration of new data and see whether the theory holds. Data is broken down in small parts (coding), in order to rebuild by identifying relationships between parts.
The analytic process of breaking down and rebuilding data in grounded theory happens in several steps:
- Open coding
the identification of an initial set of themes or categories (called codes[1]). “The analytic process through which concepts are identified and their properties and dimensions are discovered” (Strauss and Corbin 1998, p. 101). In this stage the data is divided into bits of text, which are given a label. This means the researcher isolates meaningful parts relevant to answer the research question.[see before]
- Axial coding
This is a way of refining the initial codes. “The process of relating categories to their subcategories termed “axial” because coding occurs around the axis of a category, linking categories at the level of properties and dimensions” (Strauss and Corbin 1998, p. 123). Open coding results in a long list of separate codes. During axial coding all these loose ends are connected. This way concepts are identified.
- Selective coding
This is the movement towards “the development of analytical categories by incorporating more abstract and theoretically based elements” (Pope and Mays, p. 71). “The process of integration and refining the theory” (Strauss and Corbin 1998, p. 143). During this third and last step in the analytic process concepts are linked, a theory is built. Often a theory is build around one central concept (category of codes).
During the coding process data has been reduced to meaningful conceptualizing categories. Nvivo (see XXX) offers several (visualization) tools (e.g. circle diagrams, charts, matrixes) to discover relations between categories.
[1] In the literature about Grounded Theory ‘codes’ is mostly used but they correspond to what we called ‘conceptualizing categories ‘ before [Add crossref]
4.6. Software to analyse qualitative data
Analysis may either be done manually or by using qualitative analysis software, for example Nvivo©[2], Atlas ti©[3], Maxqda©[4], etc.
These Computer-Assisted Qualitative Data Analysis Software (CAQDAS) offer a support to the analyst with the storage, coding and systematic retrieval of qualitative data35. They are able to manage different types of qualitative materials, such as transcripts, texts, videos, images, etc. their utility for the analysis depends on the size of the corpus of analysis (number of interviews, plurality of the data sources) and has not to be automatic. They also could be useful for collaborative purposes when several researchers are analysing the same data. They not guarantee the scientific nature of the results62. Indeed, quality of the results does not depend on the tool used, but on the scientific rigor and the systematic analysis of the data.
[2] http://www.qsrinternational.com/products_nvivo.aspx
[3] http://www.atlasti.com/index.html
5. How to report qualitative research findings?
Interviews can be presented in a number of ways, there is no specific format to follow. However, alike other research methods, justification and methodology of the study should be provided. The research process should be fully transparent so that any researcher can reproduce it. In addition, it should be comprehensible to the reader.
A possible structure could be:
1. Introduction and Justification
2. Methodology
2.1 How were respondents recruited?
2.2 Description of the sample
2.3 Description of selection biases if any
2.4 What instruments were used to collect the data?
You may want to include the topic list or questionnaire in an appendix
2.5 Over which period of time was the data collected?
3. Results : What are the key findings?
4. Discussion
4.1 What were the strengths and limitations of the information?
4.2 Are the results similar or dissimilar to other findings
(if other studies have been done)?
5. Conclusion and Recommendations
6. Appendices (including the interview guide(s)/ topic guide)
&
When writing up findings qualitative researchers often use quotes from respondents. Quotes are useful in order to63:
- Illustrate the themes emerging from the analysis.
- Provide evidence for interpretations, comparable to the use of tables of statistical data appearing in reports based on quantitative findings.
- Strengthen credibility of the findings (despites critics argue that researchers can always find at least one quote to support any point they might with to make).
- Deepen understanding. The actual words of a respondent could sometimes be a better representation of the depth of feeling.
- Enable voice to research participants. This enables participants to speak for themselves and is especially relevant in a participatory paradigm.
- Enhance readability by providing some vividness and sometimes humour: Braking up long passages of text by inserting spoken words, could help to keep the reader focused, but there could be a danger in moving too far towards a journalistic approach.
Ideally, quotes are anonymous and are accompanied by a pseudonym or description of the respondents. For example, in a research about normal birth, this could be: (Midwife, 36 years). There are however exceptions the rule of anonymity, e.g. stakeholder interviews, in which the identity of the respondent is important for the interpretation of the findings. In that case the respondent should self-evidently be informed and his agreement is needed in order to proceed.
Also in terms of lay out quotations should be different from the rest of the text, for example by using indents, italic fond or quotation marks. Quotes are used to strengthen the argument, but should be used sparingly and in function of the findings. Try to choose citations in a way that all respondents are represented. Be aware that readers might give more weight to themes illustrated with a quotation.
When the research is conducted in another language than the language of the report in which the findings are presented, quotes are most often translated. “As translation is also an interpretive act, meaning may get lost in the translation process (Van Nes et al, 201064, p. 313)”. It is recommended to stay in the original language as long and as much as possible and delay the use of translations to the stage of writing up the findings64.
KCE practice is to translate quotes only for publications in international scientific journals, but not for KCE reports. Although KCE reports are written in English, inserted quotes are in Dutch or French to stay close to the original meaning. The authors should pay attention to the readability of the text and make sure that the text without quotes is comprehensive to English speaking readers.
6. How to evaluate QRM?
In this section we want to address quality criteria for the use and evaluation of qualitative research. At the one hand it should guide those who want to apply QRM in their research project(s), at the other hand KCE researchers asked for criteria that allow them to evaluate existing qualitative studies or publications resulting from qualitative studies, for example in function of a systematic review.
6.1. Usefulness of quality criteria to evaluate qualitative research
“Whatever the method, it needs to be well-defined, well-argued, and well-executed” (Snijders, 2007)
The increasing demand for qualitative research within health and health services research has emerged alongside an increasing demand for the demonstration of methodological rigor and justification of research findings (Reynolds, 2011) . Not only is qualitative research challenged by the current evidence-based practice (EPB) movement in healthcare, also the emergence of meta-analyses (e.g. meta-synthesis) of qualitative research findings urges for quality criteria. Although in quantitative health sciences research, there exist widely-recognized guidelines, no comparable standardized guidelines exist for qualitative research. This can be explained by a lack of consensus related to how to best evaluate “rigor” in qualitative research (Nelson, 2008). Every qualitative paradigm has its own implications regarding the definition of good quality research. First, we introduce the reader briefly in the debate about quality criteria, second, we present the framework of Walsh and Downe (Walsh, 2006) as the most complete and comprehensible list of quality criteria to appraise qualitative research studies, and the framework of Côté and Turgeon as a shorter and practical alternative. For other checklists we refer to Appendix 1.
Among qualitative researchers there is a debate going on between those demanding for explicit criteria, for example in order to serve systematic reviewing and evidence-based practice, and those who argue that such criteria are neither necessary nor desirable (Hammersley, 2007). The quest for quality criteria assumes that qualitative research is a unified field, but this image does not fit reality. In fact, apart from a variety of other positions (e.g. symbolic interactionism, hermeneutics, phenomenology, ethnography) three main paradigms can be discerned in relation to this discussion:
- The interpretativist paradigm assumes that social realities are multiple, fluid and constructed. This framework values research that illuminates subjective meanings and multiple ways of seeing a phenomenon. These researchers question the need for and the utility of quality criteria for qualitative research or apply specific criteria for qualitative research, such as clear delineation of the research process, evidence of immersion and self-reflection, demonstration of the researcher’s way of knowing (e.g. tacit knowledge) (Cohen, 2008).
- The positivist approach stands at the other end of the continuum and assumes that there is a single objective reality that is knowable. Positivists apply traditional quantitative criteria, such as validity and reliability to qualitative work.
- The realist perspective is positioned in between. It maintains a belief in an objective reality, but knowledge of reality is always imperfect (Cohen, 2008). Realists use techniques such as triangulation, member validation of findings, peer review of findings, deviant or negative case analysis and multiple coders of data, to promote to verify findings. The realist perspective adopts a philosophy of science that is in line with positivism, but at the same time embracing the complexity of social life and recognizing the importance of social meanings. “By maintaining a belief in an objective reality and positing truth as an ideal qualitative researchers should strive for, realists have succeeded at positioning the qualitative research enterprise as one that can produce research which is valid, reliable, and generalizable, and therefore, of value and import equal to quantitative biomedical research” (Cohen, 2008, p. 336).
The position one takes in the debate about quality criteria is heavily influenced by the paradigm one feels most attracted to, or identifies with.
6.2. General quality criteria
Most of the quality criteria are applicable to all research, both quantitative and qualitative. For example in 2008, Cohen and Crabtree (Cohen, 2008) reviewed and synthesized published criteria for good qualitative research. They identified the following general evaluative criteria: 1) ethical research, 2) importance of the research, 3) clarity and coherence of the research report, 4) use of appropriate and rigorous methods, 5) importance of reflexivity or attending to researcher bias, 6) importance of establishing validity or credibility, 7) Importance of verification or reliability. Researcher bias, validity, and reliability are most heavily influenced by quantitative approaches. Table 6 bridges quantitative and qualitative research by illustrating the parallels between criteria for conventional quantitative inquiries and qualitative research.
Table 6 – Lincoln and Guba’s translation of terms
|
Quantitative research |
Qualitative research |
Methods to ensure quality |
|
Internal validity |
Credibility: Are the findings credible? |
Member checks[a]; prolonged engagement in the field; data triangulation |
|
External validity |
Transferability: Are the findings applicable in other contexts? |
Thick description[b] of setting and/or participants |
|
Reliability |
Dependability: Are the findings consistent and could they be repeated? |
Audit – researcher’s documentation of data, methods and decisions; researcher triangulation |
|
Objectivity |
Confirmability: To which extend are the findings shaped by the respondents and not researcher bias, motivation or interests? |
Audit and reflexivity – e.g. awareness of position as a researcher and its influence on the data and findings |
Source: Adapted from Finley,2006
In what follows we pay attention to some keywords appearing in Table 6.
Reflexivity
“Reflexivity is an awareness of the self in the situation of action and of the role of the self in constructing that situation.” (Bloor and Wood, 2006, p. 145)
Because in qualitative research, the researcher could not be ‘blinded’, he/she has to take into account subjectivity in an explicit way. To demonstrate this reflexive awareness during the research process, the following ‘good practices’ can be used (Green, 2009, p. 195):
- Methodological openness: report steps taken in data production and analysis, the decisions made, and the alternatives not pursued.
- Theoretical openess: theoretical starting points and assumptions should be adressed.
- Awareness of the social setting of the research itself: be aware of the interactivity between the researcher and the researched.
- Awareness of the wider social context, including historical and policy contexts and social values.
Triangulation
“Qualitative research is inherently multimethod in focus (Flick, 2002, p.226-227). However, the use of multiple methods, or triangulation, reflects an attempt to secure an in-depth understanding of the phenomenon in question. Objective reality can never be captured. We know a thing only through its representations. Triangulation is not a tool or a strategy of validation, but an alternative to validation (Flick, 2002, p. 227). The combination of multiple methodological practices, empirical materials, perspectives, and observers in a single study is best understood, then, as a strategy that adds rigor, breadth, complexity, richness, and depth to any inquiry (See Flick, 2002, p. 229)” (Denzin and Lincoln, 2008, p. 7).
Triangulation is the use of several scientific methods, both qualitative and quantitative, to answer the same research question (Bloor, 2006) . Often triangulation is understood as producing the same results by means of several methods, sources or analysts. However, different methods or types of inquiry are sensitive to different nuances, so that they may lead to somewhat different results. In fact, triangulation is more about finding inconsistencies to gain deeper insight into the relationship between the inquiry approach and the subject under study. Thus, finding inconsistencies do not weaken the credibility of the results, but rather strengthen it (Patton, 1999).
Five kinds of triangulation can contribute to the quality and consistency of qualitative data analysis:
- Methods triangulation: Information obtained through several methods is compared. These methods can be qualitative, or quantitative or both. Often qualitative and quantitative data can be fruitfully combined as they mostly elucidate complementary aspects of the same phenomenon (Patton, 1999) .
- Triangulation of sources: Information derived at different times and by different means is compared, e.g. comparing observational data with interview data, but also comparing what people say in public with what they say in private (Patton, 1999) .
- Analyst triangulation: Several observers, interviewers, researchers or analysts are used. By this way the potential bias that comes from a single person doing all the data collection and/or data analysis is reduced. In addition to several researchers or data analysts, analytical triangulation may also be to have those who were studied review the findings (Patton, 1999) .
- Theory/perspective triangulation: It involves the use of different theoretical perspectives to look at the same data. Also, for example, data can be examined from the perspective of various stakeholder positions (Patton, 1999) .
- Member validation: It is a popular kind of triangulation that consists of “checking the accuracy of early findings with research respondents” (Bloor and Wood, 2006, p. 170).
These kinds of triangulation protect the researcher against the accusation that findings are an artifact of a single method, or source or investigator’s biases (Patton, 1999).
Transferability
Earlier in this report we argued that qualitative research is context sensitive and it is not aimed at making generalizations to the wider population. This may appear to contradict with the notion of transferability which is just about the extent to which findings of one study can be applied to other situations (external validity) (Merriam, 1998).
Transferability refers to the responsibility of the researcher to provide sufficient contextual information about the fieldwork to enable the reader to determine how far he can be confident in transferring the findings to other situations (Firestone, 1993). However, the situation might be complicated by the possibility that factors considered by the researcher to be unimportant, and consequently unaddressed in the research report, may be critical in the eyes of a reader(Firestone, 1993) .
6.3. Checklists
We have found four papers (Reynolds, 2011; Walsh, 2006; Cohen, 2008; Côté and Turgeon, 2005) reviewing the literature on quality criteria or guidelines for qualitative research. One of them (Walsh, 2006) provides us with a synthesis of eight existing checklists and summary frameworks (see Table 7). This checklist is quite detailed and is designed in function of meta-synthesis, which is a kind of systematic review of qualitative research papers.
The list of criteria was built in order to rigorously appraise studies first before submitting them to the meta-synthesis technique. Agreement on criteria to judge rigor was necessary in order to decide which studies to include in the meta-synthesis. Walsh and Downe (Walsh, 2006) tabulated the characteristics mentioned in each of the papers in their review. Then they mapped together the characteristics given in all the included papers, sorting them by the number of checklists in which they appeared. In the next step both authors independently attempted a synthesis before coming together to discuss. Redundant criteria were excluded if both authors agreed that the exclusion would not change the final judgment on the meaningfulness and applicability of a piece of qualitative research. Finally the table below was constructed, structured into three columns, namely stages, essential criteria and specific prompts. Although some criteria may seem self-evident, others are less obviously fundamental (Walsh, 2006). This list of criteria is very detailed. In some studies, especially those with short time frame, a shorter and more pragmatic hands-on list could be practical. Therefore we also added the grid of Côté and Turgeon [c] (Table 8) which is shorter, adapted to the specific context of heath care and easier to use for researchers who are less familiar with qualitative research. Other checklists are described in Appendix 1.
The use of a checklist may improve qualitative research, however they should be used critically: not every criterion is appropriate to every research context (Barbour, 2001). For example the list of Coté and Turgeon mentions interpretation of results in an innovative way as a quality criterion (point 10, Table 8), while this is not necessarily the case. Most important is a systematic approach during research process. For example the credibility of data analysis could encompass the use of software (Table 7), triangulation and/or member checking (point 7, Table 8), whereas a systematic approach with a detailed description of each step in the research process could have been sufficient.
Table 7 – Summary criteria for appraising qualitative research studies
|
Stages |
Essential criteria |
Specific prompts |
|
Scope and purpose |
Clear statement of, and rationale for, research question / aims / purposes |
|
|
|
Study thoroughly contextualized by existing literature |
|
|
Design |
Method/design apparent, and consistent with research intent |
|
|
|
Data collection strategy apparent and appropriate |
|
|
Sampling strategy |
Sample and sampling method appropriate |
|
|
Analysis |
Analytic approach appropriate |
|
|
Interpretation |
Context described and taken account of in interpretation |
|
|
|
Clear audit trail given |
|
|
|
Data used to support interpretation |
|
|
Reflexivity |
Researcher reflexivity demonstrated |
|
|
Ethical dimensions |
Demonstration of sensitivity to ethical concerns |
|
|
Relevance and transferability |
Relevance and transferability evident |
|
Source: Walsh and Downe, 2006
Table 8 – Grid for the critical appraisal of qualitative research articles in medicine and medical education
|
|
Yes |
+/- |
No |
|
Introduction |
|||
|
1. The issue is described clearly and corresponds to the current state of knowledge. |
|||
|
2. The research question and objectives are clearly stated and are relevant to qualitative research (e.g. the process of clinical or pedagogical decision-making). |
|||
|
Methods |
|||
|
3. The context of the study and the researchers’ roles are clearly described (e.g. setting in which the study takes place, bias). |
|||
|
4. The method is appropriate for the research question (e.g. phenomenology, grounded theory, ethnography). |
|||
|
5. The selection of participants is appropriate to the research question and to the method selected (e.g. key participants, deviant cases). |
|||
|
6. The process for collecting data is clear and relevant (e.g. interview, focus group, data saturation). |
|||
|
7. Data analysis is credible (e.g. triangulation, member checking). |
|||
|
Results |
|||
|
8. The main results are presented clearly. |
|||
|
9. The quotations make it easier to understand the results. |
|||
|
Discussion |
|||
|
10. The results are interpreted in credible and innovative ways. |
|||
|
11. The limitations of the study are presented (e.g. transferability). |
|||
|
Conclusion |
|||
|
12. The conclusion presents a synthesis of the study and proposes avenues for further research. |
Source: Côté and Turgeon,2005
[a] Informants may be asked to read transcripts of dialogues in which they have participated to check whether their words match with what they actually intended (Shenton 2004), or they may be asked to check the accuracy of early findings (Bloor 2006) 35.
[b] Thick description refers to rich qualitative data allowing not only the description of social behaviour, but also to connect it to the broader context in which it occurred (Mortelmans 2009).
6.4. Conclusion
To conclude this chapter on quality criteria we wish to warn against a rigid use of checklists and quality criteria in qualitative research and to argue instead for flexible use. Moreover this also applies to quantitative research.
Barbour criticizes the widespread use and description of assumed quality indicators like theoretical sampling, grounded theory, multiple coding, and triangulation in scientific articles, as an unequivocal guarantee of robustness. These dimensions of qualitative research should be embedded within a broader understanding of the qualitative research design and not “stuck on as a badge of merit” (Barbour, 2001, p. 1115).
We agree with Walsh and Downe (Walsh, 2006) that a checklist is indicative of good quality research, but not a guarantee.
Key messages
- Although in quantitative health sciences research, there exist widely-recognised guidelines, no comparable standardised guidelines exist for qualitative research.
- Among qualitative researchers there is a debate going on between those demanding for explicit criteria, for example in order to serve systematic reviewing and Evidence-Based Practice, and those who argue that such criteria are neither necessary nor desirable.
- The framework of Walsh and Downe as an comprehensible example of quality criteria checklist to appraise qualitative research studies. The grid of Côté and Turgeon is more simple and could be recommended as tool for evaluation in KCE reports.
INTRODUCTION TO SYSTEMS THINKING IN HEALTH SERVICES RESEARCH
1 WHY USE SYSTEMS THINKING?
Some problems are very persistent despite a lot of efforts by plenty of people to solve them. Examples are climate change, antibiotics over- and misuse, …. Persistent problems tent to be complex problems for which our traditional linear thinking recipes are ineffective. Einsteins quote “We can not solve our problems with the same level of thinking that created them” descibes this need to search for new and more appropriate ways to tackle these problems. Systems thinking is one of the lenses potentially providing clarity in complex problems. Other useful perspectives are complexity theory and design thinking.
A key understanding within systems thinking is that a system as a whole cannot be understood by analysis of its separate parts (M.Q. Patton 2015). The functions and meanings of the parts are lost when separated from the whole.
2 WHAT IS A SYSTEM?
Meadows defines a system as “an interconnected set of elements that is coherently organized in a way that achieves something” (p. 11). Hence a system consists of three kinds of things: elements, interconnections, and a function or purpose. Elements are mostly visible tangible things, and are therefore the easiest to notice. You can divide elements into sub-elements and then in sub-sub-elements. Instead of intersecting elements, it is more interesting to look at the interconnections. The interconnections are the relationships that hold the elements together. If interconnections or purposes change, the systems behavior may alter drastically. Purposes are deduced from behavior, not from rhetoric or stated goals. Systems can be nested within systems. Therefore, there can be purposes within purposes. Sub-purposes can come into conflict with the overall purpose. Keeping sub-purposes and the overall system purposes aligned, is essential for a successful system (Meadows 2008).
BOX: Questions to ask in order to know whether you are looking at a system or just a bunch of stuff (reproduced from Meadows, D., 2008)
A) Can you identify parts?
AND
B) Do the parts affect each other?
AND
C) Do the parts together produce an effect that is different from the effect of each part on its own?
AND perhaps
D) Does the effect, the behavior over time, persist in a variety of circumstances?
3 THE ORIGIN OF SYSTEMS THINKING AND ITS LINK WITH COMPLEXITY
Systems thinking is gaining popularity and becomes increasingly influential. Its origin goes back far in history. The International Institute for General Systems Studies (IIGSS) developed a family tree going back as far as 2500 years (see http://www.art-sciencefactory.com/complexity-map_feb09.html). The origin of systems thinking is spread out over many intellectual knowledge domains. In the recent 20 to 30 years systems thinking is applied in a fast growing number of knowledge domains (e.g. sustainability, weather forecasting, social problems, public health,…).
Systems thinking is closely linked to the paradigm of complexity. During the early 1950s a number of scientists (e.g. Ashby, Bertalanffy and Boulding, founders of the ‘systems-movement’), recognized the need for a trans-disciplinary approach in order to deal with growing complexity (Nys 2014). The idea was to develop a ‘general systems theory’ (von Bertalanffy 1956).
From the study of non-linear dynamic systems (e.g. weather patterns) a new family of systems theories appeared in the late 20th century, heavily nurtured by research at the Santa Fe Institute of Complexity (Nys 2014). A paradigm shift in scientific thinking developed with at its core the shift from an orientation towards equilibrium and statics towards a kind of thinking that is oriented towards disequilibrium, self-organization, non-linear dynamics, emergence and unpredictability (Nys 2014).
Kefalas (Kefalas 2011) formulated the following main characteristics of systems thinking:
- Systems thinking is a view of the world: it is the conceptual schema by which one organizes one’s thoughts and actions with respect to reality;
- Systems thinking is interdisciplinary. It attempts to build a general viewpoint by borrowing from many seemingly diverse disciplines which is a departure from conventional scientific thinking;
Systems thinking conceives real-world phenomena as systems and stresses interrelationships and interactions among the entities generating these activities rather than on the entities themselves.
4 A PARADIGM SHIFT
Central to a systems perspective is holistic thinking, as opposite of reductionist thinking. A key understanding within systems thinking is that a system as a whole cannot be understood by analysis of its separate parts (M.Q. Patton 2015). The functions and meanings of the parts are lost when separated from the whole. Therefore a systems approach requires synthetic thinking, which is fundamentally different from analysis. To analyze is to explain by taking things apart in a first step, the contained parts are explained in a second step and finally knowledge of the parts is aggregated into knowledge of the whole. To synthesize is to see something as a part of a larger whole, next the containing whole is explained, and finally the understanding of the whole is disaggregated to explain the parts by revealing their role or function within that whole. Synthetic thinking reveals why a system works the way it does, but not how it does so. Analysis and synthesis are complementary and systems thinking incorporates both (M.Q. Patton 2015).
[To develop further]
5 TWO APPROACHES WITHIN SYSTEMS THINKING
At its broadest level, systems thinking encompasses a large and fairly amorphous body of methods, tools, and principles, all oriented to looking at the interrelatedness of forces, and seeing them as parts of a common process” (Senge et al. 1994)).
Systems thinking appears fragmented as it covers many different meanings, models, approaches and methodologies, including for example system dynamics, soft systems methodology and critical systems thinking (M. Q. Patton 1999). Therefore it is not surprising that systems thinking serves several purposes. Each “sub discipline” has its own objectives and represents a different way to approach complexity. System dynamics are appropriate when the aim is to clarify complexity and/or predict future behavior of a system, systems thinking reveals a variety of potential actions you may take to bring about change in a strategically desired direction. “Each of these actions will produce some desired results and (almost certainly) some unintended consequences somewhere else in the system. The art of systems thinking includes learning to recognize the ramifications and trade-offs of the action you choose” (Senge et al. 1994)
5.1 Soft Systems Methodology (SSM)
5.1.1 What is it about?
Checkland and Poulter defined SSM as follows:
“SSM is an organized way of tackling perceived problematical (social) situations. It is action oriented. It organizes thinking about such situations so that action to bring about improvement can be taken” (Checkland and Poulter 2010), p. xv).
SSM uses system ideas developed within hard systems thinking in problem solving. SSM is an approach which in a systematic way tries to establish and structure a debate concerning actions for improving the problem situation (Simonsen, 1994, http://www.jespersimonsen.dk/Downloads/SSM-IntroductionJS.pdf)(Simonsen 1994). Soft systems approaches diverge from hard systems approaches in explicitly integrating the assumption that an objective representation of reality does not exist. Our perspective is always directed and filtered by our world view. We always have only a partial picture of reality (See illustration).
Illustration: The blind men and the matter of the elephant (reproduced from Meadows, D., 2008, p. 7)
Beyond Ghor, there was a city. All its inhabitants were blind. A king with his entourage arrived nearby; he brought his army and camped in the desert. He had a mighty elephant, which he used to increase the people’s awe.
The populace became anxious to see the elephant, and some sightless from among this blind community ran like fools to find it.
As they did not even know the form or shape of the elephant, they groped sightlessly, gathering information by touching some part of it.
Each thought that he knew something, because he could feel a part…
The man whose hand had reached an ear… said: “It is a large, rough thing, wide and broad, like a rug.”
And the one who had felt the trunk said: “I have the real fact about it. It is like a straight and hollow pipe, awful and destructive.”
The one who had felt its feet and legs said: “It is mighty and firm, like a pillar.”
Each had felt one part out of many. Each had perceived it wrongly…
This ancient Sufi story was told to teach a simple lesson but one that we often ignore: The behavior of a system cannot be known just by knowing the elements of which the system is made.
Soft system methodology tries to align the partial pictures to be able to take coordinated action. This radical constructivist perspective includes that social systems do not exist as such, but are always informed by intentionality. Identifying this intentionality is at the core of SSM (Vandenbroeck 2015).
In short, SSM can be characterised by the following points:
- In contrast to the approaches described above (grounded theory and framework analysis), SSM is an action-oriented approach, which means that its purpose is to enable actions to improve (Checkland, 2000, research paper)(Checkland 2000). The change sought can be structural change, process change or changes of attitude, or all three at once (Checkland, 2000, research paper)(Checkland 2000).
- SSM is used “to make sense of complex situations” (Checkland, 2000, research paper)(Checkland 2000).
- SSM is flexible. Any approach able to deal with the changing complexity of real life needs to be flexible, because every situation involving human beings is unique. SSM offers a set of principles which can be adopted and adapted for use in any real situation in which people want to take action to improve it. SSM is not a clear sequence of steps. (Checkland, 2000, research paper)(Checkland 2000)
- SSM is a learning cycle, which goes from finding out about a problematical situation to defining/taking action to improve it. (Checkland, 2000, research paper)(Checkland 2000)
Checkland (Checkland and Poulter 2010) emphasized that SSM is not a technique in the sense of a recipe, nor a method, but a methodology. That means it is a set of principles which can be adapted for use in a way which suits the specific nature of each situation in which it is used. The set of principles can be adopted or adapted for use in any real situation in which people are intending to take action to improve it.
5.1.2 The SSM learning cycle
Adapted from Checkland and Poulter (2010)
The SSM process takes the form of a cycle. It is a cycle of learning which goes from finding out about a problematical situation to defining/taking action to improve it. The steps in the learning cycle are described below (see also Figure X).
Figure X: The SSM’s learning cycle
|
Real system |
|
Soft system world |
|
2) Formulate root definitions |
|
3) Build activity models |
|
1) Find out about the problematical situation |
|
4) Use the models to question the real world situation |
|
5) Define actions to improve the situation |
5.1.2.1 Find out about the problematical situation
The starting point is a problematical situation. Problematical situations are characterized by:
- Multiple interacting actors with each their own perception of reality or world view
- People acting purposefully, with intention.
In the language of SSM four ways of finding out about a problematical situation are described.
a. Making rich pictures
Rich pictures are created to show multiple interacting relationships, hence illustrate the complexity of human situations. Knowledge about a situation can be assembled by means of interviews, reading documents, attending meetings etc. and be summarized afterwards in a rich picture. The pictures become richer as inquiry proceeds. In making a rich picture the aim is to capture, informally, the main entities, structures and viewpoints in the situation, the processes going on, the currently recognized issues and any potential ones. Qualitative research techniques (such as observations, interviews, focus groups) are particularly suited to build rich pictures.
b. Analyzing the intervention
Identify who are in the roles of ‘client’ and ‘practitioner’, and who could be included in the list of issue owner?
- The client is the person or group of persons who caused the intervention to happen.
- The practitioner is the person or group of persons who were conducting the investigation
- Owner of an issue are people who are concerned about or affected by the situation and the outcome of the effort to improve it.
c. Analyzing the social
If we want to know whether a practical action could improve a situation, then the changes involved in ‘improvement’ have to be not only desirable but also culturally feasible. They need to be possible for particular people, with their particular history and their particular world views.
Three elements help to create the social texture of a human situation:
- Roles or social positions differentiating between members of an organization. Some roles are formally recognized (e.g. director, department head, team member etc.) other roles are informal and linked to individuals’ reputation.
- Norms are expected behaviors associated with a role.
- Values are the standards by which role behavior gets judged.
Every time you interact with the situation by talking to people, reading documents, sitting in a meeting, conducting an interview, you learn about the roles, norms and values characterizing a particular group. Document them by writing down notes or memo’s.
d. Analyzing the political
The political is about the disposition of power in a situation and the processes for containing it. This is a powerful element in determining what is culturally feasible. Politics is also about accommodating different interests. In this analysis it is asked ‘how is power expressed in this situation?’ What are the commodities (e.g. personal charisma, membership of various committees, reputation, access to information, etc.) which signal that power is possessed in this situation? What are the processes, by which these commodities are obtained, used, protected, defended, passed on, relinquished, etc.
5.1.2.2 Formulate root definitions
In order to construct an activity model, we need a statement describing the activity system to be modelled. This description is the root definition (RD), i.e. the description of what the system does, how and why. This is known as the PQR formula: do P (what), by Q (how), in order to help achieve R (why). The root definition is written out as a statement modelling a transformation process.
Although the PQR formula helps to define the root definition, which is the basis for the activity model, it can be further enriched by the use of the mnemonic CATWOE. The idea is that purposeful activity, defined by a transformation process (T) and a worldview (W) will require people (A) to do the activities which make up T. It will affect people (C) outside itself who are its beneficiaries or victims. It will take as given various constraints from the environment outside itself (E). It could be changed or stopped by persons (O) who are regarded as owning it.
- C customers
- A actors
- T transformation
- W worldview
- O owners
- E environmental constraints
5.1.2.3 Build activity models
Building activity models means putting together the activities needed to describe the transforming process, in other words defining and linking the activities needed to achieve the transformation process. It is about the activities which do the transforming. Every phrase in the root definition should lead to something in the model, and every activity in the model must be linkable to something in the root definition.
The purposeful activity models can never be descriptions of (a part of) the real world. They model only one way of looking at reality, one world view. Activity models are devices which make sure that the learning process is not at random, but organized.
In addition to the root definition, it is useful to include control and monitoring activities by thinking about performance criteria, such as efficacy, (is the intended outcome produced?), efficiency (is the transformation achieved with a minimum use of resources) and effectiveness (does the transformation help achieve some higher-level or longer term aim?)
Activity models do not model the current ways of working but rather the concepts in the root definition. The aim is to question current practice by comparing the model to the real world situation.
It is useful to make models of purposeful activities whose boundaries cut across organizational boundaries, instead of accepting the organizational boundaries as a given. Purposeful activities are often institutionalized within departments, divisions, sections etc. Therefore it is tempting to model activities along internal organizational boundaries. Although this is not wrong, one should be conscious about the limitations this brings about. For example, organizational boundaries of departments are often linked to power play going on in organizations, because it is about allocating resources. To stimulate the (out of the box) thinking of the researchers it is useful to make models of purposeful activity cutting across organizational boundaries, hence independent of existing structures. You should not be modelling the current ways of working, but rather questioning current practice and build theoretical activity models, which are next compared to the real world. Also remember to stay focused on the root definition when building the model. Notice that the activity models do not purport to become accounts of what we would wish the real world to be like. They could not, since they are artificial devices based on a pure worldview, whereas human groups are always characterized by multiple conflicting worldviews (even within one individual) which themselves change over time.
The following steps could help you to build activity models:
1) Assemble the guidelines: PQR, CATWOE etc.
2) Write down three groups of activities – those which concern the thing which gets transformed, those activities which do the transforming, and any activities concerned with dealing with the transformed entity.
3) Connect the activities by arrows which indicate the dependency of one activity upon another.
4) Add the three monitoring and control activities.
5) Check the model against the guidelines. Does every phrase in the root definition lead to something in the model? Can every activity in the model be linked back to something in the root definition?
As a guideline, the operational part of the model could contain 7+/-2 activities.
5.1.2.4 Using the models to question the real world situation
As already explained, the activity models are the devices or tools which enable that discussion is a structured rather than a random one. The models are sources of “good” questions to ask about the real situation, enabling it to be explored richly. For example: here is an activity in this model, does it exist in the real situation? Who does it? How? When? Who else could do it? The questions resulting from the comparison between the activity model(s) and the real world could be addressed in a focus group or even an individual face-to-face interview. An informal approach is to have a discussion about improving the situation in the presence of the models. If some relevant models are on flip charts on the wall, they can be referred to and brought into the discussion at appropriate moments. We could ask whether we would like activity in the situation to be more, or less, like that in the model. Such questioning organizes and structures a discussion/debate about the real world situation. The purpose of the discussion is to surface different worldviews and to seek possible ways of changing the problematical situation for the better.
Note that the models are not meant to be accounts of what we would wish the real world to be like. It is dangerous to talk about the comparison between the real situation and the models, because it can be taken to imply that the discussion focusses on deficiencies in the situation when set against the ‘perfect’ models. The models only reflect pure worldviews, which in real situations co-occur within the group or even within one person.
An activity model and the questions being raised out of the comparison between the model and the real situation, can be summarized in a matrix (type excel table) (see Table X). The model provides the left-and column, consisting of activities and connections from the model, while the other axis contains questions to ask about those elements. The task is then to fill in the matrix by answering the questions.
Table X: Example of a matrix template
|
Activities |
Exist? |
Who does it? |
When? |
How? |
|
A |
|
|
|
|
|
B |
|
|
|
|
|
… |
|
|
|
|
5.1.2.5 Define/take action to improve the situation, seek accommodation
Identifying different world views and seeking ways for improvement, means finding an accommodation, this is “a version of the situation which different people with different worldviews could nevertheless live with” (Checkland and Poulter 2010 p. 55). Checkland and Poulter (Checkland and Poulter 2010) explicitly differentiate accommodation from consensus. Consensus is static and suggests that everyone agrees about everything, while accommodation “emphasizes the provisional and even precarious character of an agreement between different interests and perspectives” (Vandenbroeck 2015). Accommodations involve compromise or some yielding of position. It is a necessary step in moving to deciding about what to do in a particular situation.
“As discussion based on using models to question the problematical situation proceeds, worldviews will be surfaced, entrenched positions may shift, and possible accommodations may emerge. Any such accommodation will entail making changes to the situation, if it is to become less problematical, and discussion can begin to focus on finding some changes which are both arguably desirable and culturally feasible. In practical terms it is a good idea not to try and discuss the abstract idea ‘accommodation’ directly. It is best approached obliquely through considering what changes might be made in the situation and what consequences would follow. The practical way forward in seeking accommodation is by exploring possible changes and noting reactions to them” (Checkland and Poulter 2010) p. 58).
Change in real situations usually entails making changes to structures, processes or procedures, and attitudes. Structure is the easiest to change. But new structures usually require both new processes and new attitudes on the part of those carrying out the processes or being affected by them.
Questions which can inspire discussions leading to accommodation are:
- What combination of structural, process and attitudinal change is needed?
- Why?
- How can it be achieved?
- What enabling action is also required?
- Who will take action?
- When?
- What criteria will judge
- success/lack of success
- completion
These questions represent things to think about when considering changes which are both desirable and feasible. The question about “enabling action” refers to which actions are needed to make a potential change accepted. This recognises the social context in which any change is embedded. Because of this context, introducing the change may require enabling action, which is not directly part of the change itself.
Concluding remark:
Notice that the four stages of the SSM learning cycle should not be treated as a sequence of steps. “Although virtually all investigations will be initiated by finding out about the problematical situation, once SSM is being used, activity will go on simultaneously in more than one of the ‘steps’” (Checkland and Poulter 2010) p. 14).
5.2 System dynamics
System dynamics are a toolbox to model the dynamics of complex systems (Vandenbroeck 2015). System dynamic models are used in many different fields (e.g. climate change). Key to the system dynamics approach is that it understands the behavior of a system as the result of cause and effect relationships between parts of a system (Vandenbroeck 2015). Feedback and delays are the core mechanisms which enable simulation of complex non-linear dynamic systems’ behavior. Peter Senge applied system dynamics to bottlenecks in organisations (Senge et al. 1994).
In what follows we present tools to analyse a problematic situation from a systems thinking perspective. Some of them owe to system dynamics as used by Peter Senge (Senge 1990) to understand and elicit organizational change. The iceberg, reinforcing and balancing feedback loops are explained, archetypes are presented and Senge et al.’s seven steps for breaking through organizational gridlock are described. These tools are especially valuable to identify patterns and feedback processes and how they can generate (problematic) patterns of behavior within organizations or systems at large.
5.2.1 The iceberg model
The iceberg is a metaphor associated with systems thinking (Senge 1990). Systems thinking approaches problems by asking how various elements within a system influence one another. The visible world around us is represented by the top of the iceberg, but this is only a “manifestation of patterns and structures that are below the water surface, hence cannot be observed directly” (Vandenbroeck 2015). What happens under water is what creates the icebergs behavior at its top. The iceberg represents a hierarchy of levels of understanding with observable events at the top and mental models at the bottom.
- Observable events
The guiding question to find out about events is: “What just happened?”. The response is the events resulting from system behaviour or repeating patterns of cause and effect at the lower layer of the iceberg.
- Patterns/trends
Below the events level, patterns and trends become visible, by asking “What trends have there been over time?”. Similar events have been taking place over time.
- Underlying structures
At the structure level we could ask: “What is causing the pattern we are observing?” or “What are the relationships between the parts?”. Structures might consist of physical things (like buildings, roads, etc.), organisations (e.g. schools), policies (e.g. laws) or rituals (e.g. habits).
- Mental models
“Mental models are the images, assumptions, and stories which we carry in our minds of ourselves, other people, institutions, and every aspect of the world. Like a pane of glass framing and subtly distorting our vision, mental models determine what we see” (Senge et al. 1994). Also “Differences between mental models explain why two people can observe the same event and describe it differently” (Senge et al. 1994). In qualitative research we encounter mental models often in (mis)beliefs, expectations, values and attitudes.
We are unaware of our mental models or those of others, until we diliberately look for them. By means of qualitative research, and especially in combination with a systems thinking or grounded theory approach, we can bring mental models to the surface and explore them. Once we identified them we can try to re-form mental models or create new ones that serve us better in the world. Soft systems methodology (but also for example imagineering) can help us doing this. Mental models are the deepest layer of the iceberg, which is suggesting that they are difficult to reach and unresponsive to change. However, if mental models can be changed they offer the highest leverage for change (e.g. within an organisation or system) (Senge et al., 1994).
“The lower level of the iceberg gives context and meaning to the higher level” (Vandenbroeck 2015). For every event you can work your way down the iceberg through the patterns, underlying systems and mental models. It can also be useful to move up and down between levels as you think more about the event. The iceberg should help to broaden your perspective. Each layer offers opportunities to “enter” the system. New leverage points, these are points at which to intervene in a system to systematically transform it, may become apparent.
5.2.2 Reinforcing and balancing feedback loops
Adapted from Senge, P. et al. 1994, the fifth discipline field book, p. 113-120
In a feedback loop every element is both ‘cause’ and ‘effect’. For every variable you can trace links that represent influence on another element. This way cycles are revealed that repeat themselves. Figure X presents an example with increasing numbers of patients increasing waiting times in a clinic, and increasing waiting times leading to decreasing numbers of patients, leading to decreasing waiting times again, and so on.
Figure X: Example of a feedback loop
There are basically two building blocks of all systems representations:
- Reinforcing loops: generate growth and collapse, in which the growth or collapse continues at an ever-increasing rate. A small change builds on itself, resulting in big changes after some time. There can be any number of elements in a reinforcing loop, all propelling each others’ growth. Reinforcing loop situations generally “snowball” into highly amplified growth or decline. Somewhere sometime the reinforcing loop will run up against at least one balancing mechanism that limits it. The letter R is used to mark a reinforcing loop.
- Balancing loops: generate stability. Balancing processes generate the forces of resistance, which eventually limit growth. Balancing loops are found in situations which seem to be self-correcting and self-regulating. The letter B is used to mark a balancing loop.
In addition to feedback loops also time needs to be taken into account. Both in reinforcing and balancing loops delays may occur. Delays are the points where the link takes a particularly long time to play out. Delays can have enormous influence in a system, frequently accentuating the impact of other forces. When unacknowledged delays occur, people tent to react impatiently, usually redoubling their efforts to get what they want. This results in unnecessarily violent oscillations. One of the purposes of drawing systems diagrams is to flag the delays which you might otherwise miss.
5.2.3 System Archetypes
Adapted from Senge, P. et al. 1994, the fifth discipline field book, p. 165-172
Archetypes are accessible tools with which credible and consistent hypotheses can be constructed. Kim and Lannon (Kim and Lannon 1997) rightly point out that they can be used in at least for different ways:
- As “lenses”: it is not about which archetype is “right”, but rather about what unique insights each archetype offers.
- As structural pattern templates: archetypes can help focus a group’s attention on the heart of an issue. After a group has drawn a causal loop diagram of the problem at hand, they can stand back and compare their diagram with the pattern of an archetype.
- As dynamic scripts (or theories): each archetype offers prescriptions for effective action. Once we recognize a specific archetype at work, we can use the theory of that archetype to expel a particular problem and work toward an intervention.
- As tools for predicting behavior: systems archetypes can help us identify predetermined outcomes of a particular situation.
To find out which archetype applies, a good strategy is to look at your situation through the lens of several different archetypes. Two or three may fit together, each highlighting a different aspect.
You can start by drawing just a simple balancing or reinforcing loop. Then add more elements, one link at a time. About each element ask what is causing changes in this element, and also what is the effect when this variable changes.
In what follows, three archetypes are presented. However many more archetypes are described in
- Senge, P. et al. 1994, The fifth discipline field book, p. 125 – 150.
- Meadows, D. 2008, Thinking in Systems. p. 110 – 141.
5.2.3.1 The “fixes that backfire” archetype
The central theme of this archetype is that almost any decision carries long-term and short-term consequences, and the two are often diametrically opposed. A problem symptom cries out for resolution. A solution is quickly implemented (the fix) which alleviates the symptom (balancing loop), but the unintended consequences of the fix (reinforcing loop) actually worsen the performance or condition which we are attempting to correct.
Example: child abuse is underreported to authorities. In the US they made reporting mandatory. However, child protection services were not reinforced, hence were overwhelmed by the number of reports, and could only investigate a small part of all reports. By consequence they got the reputation of being untrustworthy. In response, people decided not to report (although mandatory) and tried to find solutions themselves or did not do anything. Number of reports decreased again, hence the problem of underdetection was reinforced.
Figure X: System dynamics model for “Fixes that backfire” – example
5.2.3.2 The “Limits to growth” archetype
We never grow without limits. In every aspect of life, patterns of growth and limits come together. In this archetype the growth process is usually shown as a virtuous reinforcing loop. The limiting process is usually shown as a balancing loop, which reacts to imbalances imposed on it by the growth loop. The balancing loop is also driven to move toward its target – a limit or constraint on the whole system, difficult to see because it is so far removed from the growth process.
By pushing hard to overcome the constraints, we make the effects of those constraints even worse than they otherwise would be. Typically, there has been an acceleration of growth and performance, usually the result of hard work, but the growth mysteriously leveled off. A natural reaction is to increase efforts that worked so well before. However, the harder you push, the harder the system seems to push back. Some source of resistance prevents further improvements. Instead of the expected growth, performance remains in equilibrium or completely crashes.
The limiting force may be within the organization, within ourselves or it might be external (e.g. a saturated market).
Example: Quality improvements within an organization often start with the quick wins. This may lead to significant gains in the quality of services or processes. But as the easy changes (known as the low hanging fruit) are completed, the level of improvement plateaus. The next wave of improvements are more complex and tougher to make. The lack of organization-wide support may become a limiting factor.
Figure X: System dynamics model for “limits to growth” - example
5.2.3.3 The “Shifting the burden” archetype
A ‘shifting the burden’ situation (like a ‘fixes that backfire’ situation) usually begins with a problem symptom that prompts someone to solve it. The solution(s) relieve(s) the problem symptom quickly. However the solutions divert the attention away from the fundamental source of the problem.
The ‘shifting the burden’ model has two balancing loops, each representing a different type of fix for the problem symptom:
- The upper loop is a symptomatic quick fix
- The bottom loop represents measures which take longer (note the delay) and are often more difficult, but ultimately address the real problem.
In many ‘shifting the burden’ situations there are additional reinforcing loops. Like the “unintended consequences” loop in ‘fixes that backfire’, these loops represent unintended consequences that make the problem worse.
Example: Many cases of child abuse remain undetected (= problem symptom). An attempt to fix this underdetection could be to increase detection skills of general practitioners and pediatricians. However, if physicians detect more cases of child abuse, they often rely on child protection services for support, advice or to report the case. This means more work for the already overburdened protection services. They cannot manage the overwhelming demands of physicians and restrict uptake criteria or respond with ‘you are doing fine’. Physicians get discouraged and feel let down. As trying to handle cases of child abuse is very time and energy consuming, physicians go back to their former management of bruised children. A more fundamental solution would be to invest in the capacity of child protection services. This way physicians could get the support they need in the detection of child abuse and reported cases get the specialized care they need.
Figure X: System dynamics model for “shifting the burden” – example of the detection of child abuse
5.2.3.4 Links to other archetypes
- https://thesystemsthinker.com/a-pocket-guide-to-using-the-archetypes/
- http://www.systems-thinking.org/arch/arch.htm
- http://blog.iseesystems.com/tag/archetypes/
5.2.4 Seven steps to break through organizational gridlock
Adapted from Senge, P. et al. 1994, the fifth discipline field book, p. 165-172.
Gridlock results when people behave as if they are independent, each pulling in a different direction.
Step 1: Identify the original problem symptom
Look back over a period of time and identify a class of symptoms that have been recurring.
Step 2: Map all quick fixes
Try to map out all the fixes that have been used to tackle the identified problem. The objective is to identify a set of balancing loops that appear to be keeping the problems under control.
Step 3: Identify undesirable impacts
Actions taken by one group almost always affect others in the organization (e.g. if each team’s solution causes a problem for the other team). Identify a reinforcing process that locks the players into a patterned response.
Step 4: Identify fundamental solutions
Having identified the undesirable effects of your quick fix, you need to find a solution that will more fundamentally address the problem. You will need to look at the situation from everyone’s perspective to achieve a fundamental solution.
Step 5: Map additive side effects of quick fixes
There are usually side effects of the quick fixes that steadily undermine the viability of the fundamental solution. This leads to a reinforcing spiral of dependency.
Step 6: Find interconnections between to fundamental loops
Finding links between the interaction effects and the fundamental solution. The interaction effects create spiraling resentment, which leads to an increasing unwillingness to communicate with the other team, resulting in an ‘us’ versus ‘them’ mentality.
Step 7: Identify high leverage actions
If you are able to get a bird’s eye-view, you can see the larger grid. The process of mapping out a gridlocked situation can be a high leverage action and be a starting point for communication across walls.
You know you found a high leverage intervention when you can see the long-term pattern of behavior shift qualitatively in a system, for example if stagnation gives way to growth or if oscillations dampen. This kind of breakthrough happens most readily when you can make alterations in the structure you’ve mapped out. You either add new desirable loops or break linkages that produce undesirable impacts.
- Adding a loop: translates into designing and implementing a new process, monitoring information in a new way, or establishing new policies.
- Breaking a link: eliminating or weakening undesirable consequences of your actions or ceasing strategies which are counterproductive in the long run.
When you add loops or break links, it’s critical to try to make such mental models explicit, because the reasons underlying peoples’ actions are fundamental to the system’s structure.
6 SYSTEMS THINKING AND QUALITATIVE RESEARCH
Systems thinking and qualitative research are a fruitful combination. Some approaches to systems thinking make use of qualitative inquiry and a systems orientation can be very helpful in making sense out of qualitative data (M.Q. Patton 2015).
Specifically for system dynamics Luna-Reyes and Andersen (2003)(Luna-Reyes and Lines Andersen 2003) posit: “The question for system dynamics appears not to be whether to use qualitative data but when and how to use it” (p. 274). There is qualitative modeling that goes through the process of formalizing and analyzing feedback loops but never results in the simulation of a mathematical system dynamics model. Qualitative methods can contribute to the conceptualization, formulation and assessment of these system dynamics models. Also soft systems methodology makes use of qualitative inquiry throughout its learning cycle, for example to make rich pictures of a problematical situation.
In addition, qualitative research and systems thinking are characterized by the same ontology and – at least for soft systems methodology - epistemology. Both take a non-reductionist and subjectivist position. Qualitative research is interpretive, meaning that qualitative researchers attempt to make sense of phenomena in terms of the meaning people bring to them (Denzin and Lincoln, 2000)(Denzin and Lincoln 2000). Qualitative researchers recognize that the subjectivity of the researcher is intimately involved in scientific research and they make subjectivity their strength, rather than their weakness. This constructivist approach is also key to soft systems methodology (see ADD CROSREFF). Typically qualitative researchers ask how and why questions (see the lower layers of the iceberg model, ADD CROSSREF) as opposed to what, who and where questions (referring to the upper layers of the iceberg model, ADD CROSSREF). Qualitative research is used when things are more complex and not reducible to closed answer categories.
Systems thinking is just another way of seeing, which also offers an alternative to the reductionist way of thinking. As with qualitative research, it is not a matter of which way is best. Systems thinking is complementary, and therefore revealing. As Meadows puts it: “You can see some things through the lens of the human eye, other things through the lens of a microscope, other through the lens of a telescope, and still others through the lens of systems theory. Everything seen through each kind of lens is actually there. Each way of seeing allows our knowledge of the wondrous world in which we live to become a little more complete. At a time when the world is more messy, more crowded, more interconnected, more interdependent, and more rapidly changing than ever before, the more ways of seeing, the better” (Meadows 2008)p. 6).
WEBSURVEY
| Attachment | Size |
|---|---|
| procedure_websurvey.pdf | 393.71 KB |
| Limesurvey_kce_manual.pdf | 6.5 MB |
| Plugin_Delphi_for_Limesurvey_manual.pdf | 1.87 MB |
ECONOMIC EVALUATION AND BUDGET IMPACT ANALYSIS (HTA)
KCE has developed guidelines for economic evaluation and budget impact analysis for Belgium. For economic evaluation, there are guidelines for
- the literature review,
- the perspective of the evaluation,
- the target population,
- the comparators,
- the analytic technique,
- the study design,
- the calculation of costs,
- the estimation and valuation of outcomes,
- the time horizon,
- modelling,
- handling uncertainty and testing the robustness of the results,
- the discount rate.
The guidelines for budget impact analysis encompass specificities with respect to the target population and the comparator and refers to guidelines for economic evaluation which should also be respected in the budget impact analysis.
FORMULATION OF CLINICAL RECOMMENDATIONS (GCP)
Writing recommendations is one of the most important steps in developing a clinical guideline. (NICE, 2009) According to the GRADE system, a recommendation is depending on several factors: not only the level of evidence, but also the balance between harm and benefit, the patients’ values and preferences, and the cost of the intervention. These factors allow allocating a level of strength to the recommendation which has to be translated in the formulation of the recommendation.
In specific situations, the available literature provides no evidence, or that conflicting or poor evidence that it is not possible to draw clear conclusions. In these cases, several solutions exist: no recommendation, recommendation without grading, recommendation with low strength or an “only in research” recommendation (see Figure 1). The choice between these solutions is not easy.
This part of the process note aims to provide guidance and tips to formulate clinical recommendations with consistency. It is based on documents from other guideline developers as NICE, SIGN, IKNL, from the GRADE literature and a discussion between KCE experts involved in GCP or in data analysis. It is intended to be used by all experts (intern and extern) involved in the development of clinical guidelines.
Figure - Situations after the literature search

| Attachment | Size |
|---|---|
| GCP_figure1_ElaborationofRecommendation_24_04-2013.png | 12.44 KB |
| GCP_figure1_ElaborationofRecommendation_24_04-2013.jpg | 53.01 KB |
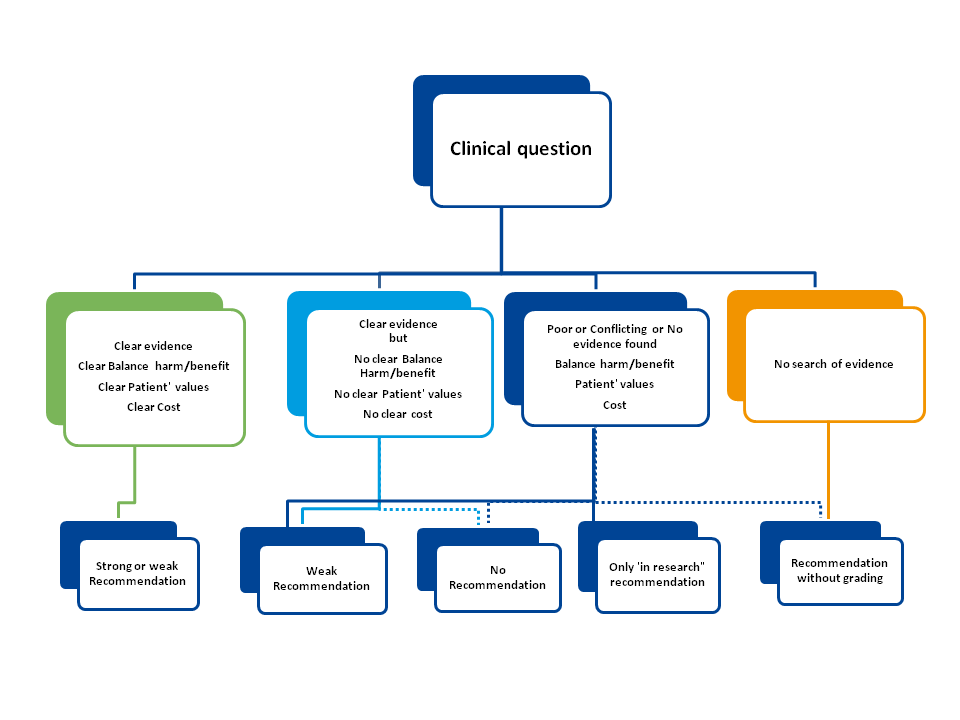
WHICH TYPE OF RECOMMENDATIONS?
Formulating a recommendation (even if the level of evidence is low) should always be the aim. The other options (not to formulate a recommendation, formulate a “only in research recommendation” or formulate a recommendation without grading) should be exceptions.
Recommendation with grading
The panellists should not be afraid with the formulation of recommendations even if evidence is poor. Absence of a statistically significant effect is no proof that an intervention does not work. It is only proven that an intervention doesn’t work if the confidence interval around the effect estimation excludes a minimally important difference or decision threshold. Even when confidence in effect estimate is low and/or desirable and undesirable consequences are closely balanced, GRADE encourages to make recommendations (inevitably weak) to avoid clinicians frustration with the lack of guidance. (Andrews et al., 2013) As the US Preventative Services Task Force states : “Even though evidence is insufficient, the clinician must still provide advice, patient must make choices, and policy makers must establish policies”.(Petitti et al., 2009)
No recommendation
Decede NOT to formulate a recommendation could be proposed2:
- When the confidence in effect estimates is so low that the panellists feel a recommendation is too speculative.
- When “although the confidence in effect estimates is moderate or even high, the trade-offs are so closely balanced, and the values and preferences and ressource implications not known or too variable, that the panel has great difficulty deciding on the direction of the recommendation”.
But as said above, choosing not to make recommendation might be an exception. And if the panel chooses to make no recommendation, the reason (low confidence in effect estimate or close balance between harm and benefit) should be specified.(Andrews et al., 2013)
“Only in research” recommendation
“Only in research” recommendation will be appropriate when 3 conditions are met(Andrews et al., 2013) :
- There is insufficient evidence supporting an intervention for a panel to recommend its use;
- Further research has a large potential for reducing uncertainty about the effects of the intervention;
- Further research is deemed good value for the anticipated costs.
Recommendation without grading
In some cases, grading a recommendation can be superfluous, but the eligibility criteria to choose this option still have to be determined by the KCE and are currently under discussion.
WORDING OF RECOMMENDATIONS - TIPS AND TRICKS
Recommendations must be decidable and executable. Do not use assertions of fact as recommendations.(Hussain et al, 2009)
Example of assertion: Suppressive therapy is effective for preventing recurrent infections.(strength of recommendation A-1)
Focus on the action (NICE, 2009)
Recommendation should begin with what needs to be done and should be as specific as possible about the exact intervention being recommended.
Prefer active voice for clarity: choose a verb as “offer”, “measure”, “advise”, “discuss”
Example:
- Instead of “an intervention is recommended”, say “offer the intervention”
- Instead of “an intervention may be offered”, say “consider offering the intervention”
Start with the verb
Exception: If recommendations differ for slightly different circumstances, it can be clearer to start with details of the patient group or other information: e.g. “If surgery is being considered, offer to…”
Use direct instructions assuming you are talking to the healthcare professional (HCP) who is working with the patient at that time.
Example: “Record the person’s blood pressure every 6 months”
Exception:
- Recommendations about service organization or for target group not HCP: “Care should be provided by a multidisciplinary team”
- Recommendations concerning a specific type of HCP: “An occupational therapist should assess the patient”
- Recommendation that use ‘must’ or “must not” because of legal aspects (see below)
Present recommendations in favour of a particular management approach rather than against an approach
Except if a useless or harmful therapy is in wide use (Andrews, 2013)
Clearly distinguish between the distinct concepts of quality evidence and strength of recommendation
Choose the verb according to the strength of recommendation
- For strong recommendation, “Offer”, “Avoid”,…
- For weak recommendations, we can add “Consider” before the verb
Add a level of evidence immediatly after each recommendation and whrite it in words
- From “Very low level of evidence” to “High level of evidence”
Use no symbols to translate the strength of the recommendation.
Be concise, unambiguous and easy to translate into clinical practice(NICE, 2009)
Consider only one action by recommendation, or by bullet point in each recommendation.
To combine briefness and accuracy, word the recommendation in one sentence and put a short text aside (e.g. by clicking) with the rational supporting the recommendation. This rational could encompass the level of evidence and the other considerations issues.
For example the reason why the recommendation is not strong: ”The addition of a systemic anti-inflammatory drug can be considered, but apart from case series, there is currently no convincing evidence that it accelerates the healing process. Moreover the balance benefit/harm is not clear’
In other words, when we're not sure, the clinician is has the right to know on what basis.
Include what readers need to know.
Even if recommendations should be clear and concise, they should contain enough information to be understood without reference to supporting material.(NICE, 2009). Recommendations too vague to be implemented (e.g. “take a comprehensive history” or “a detailed physical examination”) are unhelpful.(Guyatt, 2011) “An ideal recommendation should explicitly or implicitly answers the questions : WHO should do WHAT to WHOM, UNDER WHAT CIRCUMSTANCES, HOW, and WHY?”(Hussain, 2009)
Define any specialized terminology or abbreviation
Define the target population unless it is obvious from the context
Specify the comparator unless it is obvious. Sometimes, the setting can also be important.
Include cross-references to other recommendations if necessary to avoid the need to repeat information such as treatment regimens or definitions of terms.
Emphasise the patient’s involvement
Use “offer” and “discuss” rather than “prescribe” or “give”.(NICE, 2009)
Use words as “people” or “patients” rather than “individuals”, “cases” or “subjects”.(NICE, 2009)
For people with mental health problems, prefer “services users” or “people” instead of “patients”
For people with chronic condition, use “people” rather than “patients”
For healthy pregnant women, do not use “patients”
In the text aside the recommendation, frame values and preferences statements for recommendations particularly sensitive to the patients, and for those for which values and preferences are less certain.(Andrews, 2013)
Example:
“This recommendation places relatively more weight on this x outcome despite the increased risk of this xx adverse event”.
“Patients who prefer to avoid surgery and the high rates of gastro-oesophageal reflux disease seen after surgery, and who are willing to accept a higher initial failure rate and long-term recurrence rate, can reasonably choose pneumatic dilatation”
Formulate each “research recommendation” as an answerable questions or a set of closely related questions.(NICE, 2009)
Use the PICO framework.
Example: “Is benzoyl peroxide or adapalene more clinically and cost effective at reducing the number of non-inflammatory lesions in the treatment of acne vulgaris in adolescents?”
Group the recommendations together in a summary section to facilitate their identification
Provide an explanations of the tips in the beginning of each report for limiting the risk of misunderstanding.
GUIDELINE DEVELOPMENT: PRINCIPLES (GCP)
When clinical practice guidelines are developed at KCE, the principles of AGREE are followed. It is therefore strongly recommended to use the AGREE II instrument as a checklist during all phase of the guideline development.
Since guideline development is a time- and resource-consuming process, strict project management is needed. A generic protocol for guideline development is available on the KCE intranet (for internal use only).
ADAPTE (GCP)
The ADAPTE Collaboration is an international collaboration of researchers, guideline developers, and guideline implementers who aim to promote the development and use of clinical practice guidelines through the adaptation of existing guidelines. The group's main endeavour is to develop and validate a generic adaptation process that will foster valid and high-quality adapted guidelines as well as the users' sense of ownership towards the adapted guideline. Following the finalization of the ADAPTE Manual and Resource Toolkit and their evaluation, the ADAPTE Collaboration dissolved and transferred the ADAPTE process and its resources to the Guidelines International Network (G-I-N) to facilitate its dissemination.
G-I-N (www.g-i-n.net) made this version of the ADAPTE Manual and Resource Toolkit (version 2.0) available for free on its website. G-I-N established an Adaptation Working Group to support groups undertaking or planning to undertake guideline adaptation and to handle further developments and refinements of the ADAPTE Manual and Resource.
The current ADAPTE methodology and resources are based on the results of an evaluation conducted on a draft manual and toolkit: upon requesting the ADAPTE resources, potential users were sent a survey asking their impressions about the resources and the proposed process.
ADAPTE: To use or not to use?
The ADAPTE method remains controversial (also within KCE). Some of the discussion points are summarized below:
- One of the main arguments in favour of ADAPTE is that it would be more efficient. However, this is not proven yet, and the survey mentioned above indicated that savings in time are probably fairly modest in a lot of cases. One of the main reasons for this is the fact that the underlying evidence for each recommendation needs to be verified anyway.
- ADAPTE and GRADE: if the source guideline did not use GRADE, an appraisal and structuring of the underlying evidence is needed, which is time-consuming. On the other hand, the same is true for systematic reviews that did not use GRADE, which are often used as a starting point at the KCE.
- ADAPTE critically depends on the availability of recent high-quality guidelines that can be sufficiently trusted. These are not always available, and even high-quality guidelines do not always have exactly the same scope as the guideline to be developed. Above this, high quality (as measured by the AGREE II instrument) is not a guarantee for a correct content.
- ADAPTE may be useful because clinical recommendations do not automatically and mechanically follow from the available evidence. Interpretation by clinicians is necessary and a good recommendation can highlight the pitfalls or the acceptability issues quoted by clinicians. Ideally, these considerations are already available in the selected source guidelines. Furthermore, identifying published high-quality guidelines allows to compare our recommendations with those from other countries, institutions, etc.
These issues were discussed during two internal consensus meetings at the KCE. The following conclusions were reached:
- ADAPTE can only be used when high-quality, recent guidelines are available that are in line with the defined PICO. This implies that a GCP project always starts with a search for guidelines. The following criteria will need to be taken into account when assessing the relevance of a guideline:
- All identified guidelines will need an assessment with the AGREE II instrument by two independent reviewers. Although the domain scores of AGREE II are useful for comparing guidelines and will inform whether a guideline should be recommended for use, the AGREE Consortium has not set minimum domain scores or patterns of scores across domains to differentiate between high-quality and poor-quality guidelines. These decisions should be made in consensus by the reviewers and guided by the context in which AGREE II is being used. Quantified cut-offs, while easy to use and enhancing reproducibility, are not recommended, because they have serious validity problems. The most important domain to be taken into account is ‘Rigour of development’.
- A criterion that could be taken into account as well is the degree of detail provided by the guideline on the evidence that was used for developing the recommendations. In order to apply GRADE correctly a fair amount of detail is needed: in case it is necessary to retrieve all the primary studies, the gain of adapting a guideline becomes limited.
- Updating a guideline with a search date that is too old may not be efficient, although it is difficult to recommend a general rule. Two years could be used as a rule of thumb, although this is very context- and topic-specific.
- Each research team can decide to use or not to use ADAPTE based on written arguments. This decision should be made when the research protocol is written. In case of subcontracting, the choice of method will have to be discussed with the subcontractor. Transparent and documented judgement is key here, not the blind application of a set of rules.
- If it is decided to use ADAPTE, the ADAPTE Manual and Resource Toolkit should be carefully read. The protocol should contain a clear description of how ADAPTE will be used (e.g. only used for some research questions, update of source guidelines with new evidence, etc).
The ADAPTE methodology
The ADAPTE methodology is exhaustively presented in the ADAPTE manual, being accompanied by a resource toolkit [1]. The methods aim to suit the needs of a broad range of stakeholders (from novices to those experienced with guideline development and groups with lesser or greater resources). The key aspects are summarized below.
The adaptation process basically consists of three main phases, each with a set of modules (see Figure on next page):
- Set-up Phase: Outlines the necessary tasks to be completed prior to beginning the adaptation process (e.g., identifying necessary skills and resources).
- Adaptation Phase: Assists users through the process of selecting a topic to identifying specific health questions; searching for and retrieving guidelines; assessing the consistency of the evidence and the guideline quality, currency, content, and applicability; decision making around adaptation; and preparing the draft adapted guideline.
- Final Phase: Guides the user through the process of obtaining feedback on the document from stakeholders impacted by the guideline, consulting with the developers of source guidelines used in the adaptation process, establishing a process for the review and updating of the adapted guideline, and creating a final document.
The ADAPTE process is supported by resources to facilitate its application. Each module of the resource toolkit provides a detailed description of the steps, the products and deliverables, and the skills and organizational requirements.
At the KCE, a summary of the evidence on which the recommendations are based is usually provided in tables, and until now all selected guidelines were updated with more recent evidence. This may not always be necessary, and under time constraints experts in the field could be consulted to see if there are recent developments, provided that the search date of the guideline is not to old.
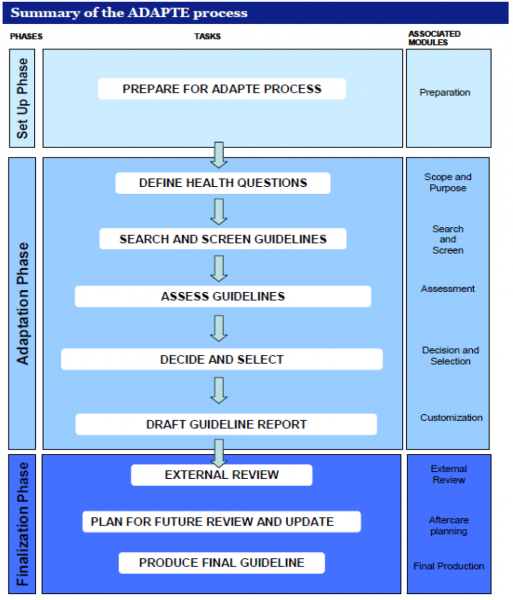
[1] Can be downloaded from the G-I-N website at http://www.g-i-n.net/activities/adaptation
GRADE SYSTEM (GCP, HTA)
1. Introduction
1.1. What is GRADE?
GRADE (Grading of Recommendations, Assessment, Development and Evaluation) offers a system for rating quality of evidence in systematic reviews and guidelines and grading strength of recommendations in guidelines. The system is designed for reviews and guidelines that examine alternative management strategies or interventions, which may include no intervention or current best management. It tries to offer a transparent and structured process for developing and presenting evidence summaries for systematic reviews and guidelines in health care and for carrying out the steps involved in developing recommendations.
The GRADE approach is based on a sequential assessment of the quality of evidence, followed by a judgment about the balance between desirable and undesirable effects, and subsequent decision about the strength of a recommendation. Separating the judgments regarding the quality of evidence from judgments about the strength of recommendations is a critical and defining feature of the GRADE system. Therefore, unlike many other grading systems, the GRADE system emphasizes that weak recommendations in the face of high quality evidence are common because of factors other than the quality of evidence influencing the strength of a recommendation, such as balance between desirable and undesirable effects, patient values and preferences and use of resources. For the same reason it allows for strong recommendations based on the evidence from observational studies.
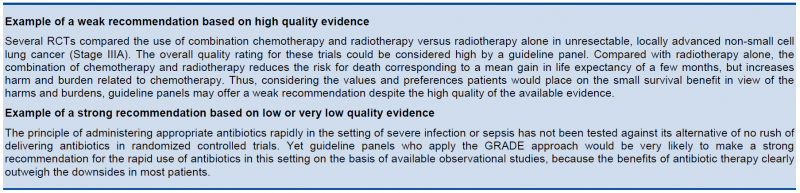
Although the GRADE system makes judgments about quality of evidence and strength of recommendations in a systematic and transparent manner, it does not eliminate disagreements in interpreting evidence nor the inevitable need for judgments in deciding on the best among alternative courses of action. This is a very important aspect and the developers of GRADE repeatedly warn against a too mechanistic approach and stress the fact that different experts can use GRADE and come to different conclusions. What matters in the first place is to ensure a maximum transparency about judgments and to explicitly acknowledge the values and preferences that underlie the recommendation.
An introduction to GRADE is given based on the guidance provided by the help function of the GRADEpro [1] software and the series of articles that appeared in the Journal of Clinical Epidemiology. This series is not yet complete and additional articles will be published in the near future, going deeper into several aspects and problems that one may encounter when trying to implement GRADE. It is, however, important to realize that most problems that are encountered when applying GRADE are not in the first place due to GRADE itself, but are general dilemmas that a scientist is confronted with when trying to use scientific evidence supporting recommendations.
Mostly, the only thing GRADE does is to confront you systematically with these problems in a way that makes it difficult to simply ignore them, by forcing you to think about and make explicit judgments on these aspects and report the results of this effort, be it on issues of heterogeneity, precision, indirectness, valid end points or publication bias.
Therefore, GRADE should not be seen as a tool for standardization in the first place, but as a tool for quality assurance and transparency.
1.2. Limitations of GRADE
GRADE is used for systematic reviews, health technology assessments and clinical guidelines. The approach differs in principle somewhat for systematic reviews but this difference is not really relevant for KCE, as KCE does not in principle produces guidelines that do not go together with recommendations.
GRADE is not designed for the evaluations of public health interventions, and is not suitable not for Health System Research. Although some principles used in grade can be useful, there are too many unresolved questions. GRADE is in the first place designed for the evaluations of interventions, be such as drugs, surgical interventions or radiation therapy. Although GRADE also deals with diagnostics the approach is far from mature in this area and its usefulness is limited, we will explain the problems in more detail at the end of the document.
Recommendations that may be helpful but do not need grading are typically those in which it is sufficiently obvious that desirable effects outweigh undesirable effects that no direct evidence is available because no one would be foolish enough to conduct a study addressing the implicit clinical question. Typically, such recommendations are supported by a great deal of indirect evidence, but teasing out the nature of the indirect evidence would be challenging and a waste of time and energy. One way of recognizing such questions is that if one made the alternative explicit, it would be bizarre or laughable.
1.3. Steps in the process
GRADE includes the following steps:
- Ask a specific healthcare question to be answered by a recommendation;
- Identify all important outcomes for this healthcare question;
- Judge the relative importance of outcomes;
- Summarize all relevant evidence;
- Grade the quality of evidence for each outcome and for each comparison;
- Decide on the overall quality of evidence across outcomes;
- Include judgments about the underlying values and preferences related to the management options and outcomes;
- Decide on the balance of desirable and undesirable effects;
- Decide on the balance of net benefits and cost;
- Grade the strength of recommendation;
- Formulate a recommendation;
- Implement and evaluate.
The steps are visualized in the following flowchart:

2. Framing the question
GRADE requires a clear specification of the relevant setting, population, intervention, comparator(s), and outcomes (see Building a search question). A guideline question often involves an additional specification, i.e. the setting in which the guideline will be implemented. For instance, guidelines intended for resource-rich environments will often be inapplicable in resource-poor environments. Furthermore, in some cases it may be necessary to specify if the guideline needs to be implemented in an inpatient or an outpatient setting.
Questions must be sufficiently specific: across the range of populations, interventions, and outcomes, a more or less similar effect must be plausible. Because the relative risk associated with an intervention vs. a specific comparator is usually similar across a wide variety of baseline risks, it is usually appropriate for systematic reviews to generate single pooled estimates of relative effects across a wide range of patient subgroups. Recommendations, however, may differ across subgroups of patients at different baseline risk of an outcome, despite there being a single relative risk that applies to all of them. Absolute risk reductions are greater in higher-risk patients, warranting taking a higher risk of side effects and enduring inconvenience. Evidence quality may also differ across subgroups, and this may mandate differing recommendations (higher likelihood of recommending an intervention, or making a stronger recommendation when evidence is of higher quality). Thus, guideline panels must often define separate questions (and produce separate evidence summaries) for high- and low-risk patients, and patients in whom quality of evidence differs.
Example
The case for warfarin therapy associated with both inconvenience and a higher risk of serious bleeding is much stronger in atrial fibrillation patients at substantial vs. minimal risk of stroke.
3. Deciding on important outcomes
3.1. General approach
Outcomes may include survival (mortality), clinical events (e.g. stroke or myocardial infarction), patient-reported outcomes (e.g. specific symptoms, quality of life), adverse events, burdens (e.g. demands on caregivers, frequency of tests, restrictions on lifestyle) and economic outcomes (e.g. cost and resource use). It is critical to identify both outcomes related to adverse effects/harm as well as outcomes related to effectiveness.
Review authors should consider how outcomes should be measured, both in terms of the type of scale likely to be used and the timing of measurement. Outcomes may be measured objectively (e.g. blood pressure, number of strokes) or subjectively as rated by a clinician, patient or carer (e.g. disability scales). It may be important to specify whether measurement scales have been published or validated.
GRADE specifies three categories of outcomes according to their importance. Guideline developers must, and authors of systematic reviews are strongly encouraged to specify all potential patient-important outcomes as the first step in their endeavour. The guideline development group should classify outcomes as:
- Critical;
- Important, but not critical;
- Of limited importance.
The first two classes of outcomes will bear on guideline recommendations; the third may or may not. Ranking outcomes by their relative importance can help to focus attention on those outcomes that are considered most important, and help to resolve or clarify disagreements. GRADE recommends to focus on a maximum of 7 critical and/or important outcomes.
Guideline developers should first consider whether particular desirable or undesirable consequences of a therapy are important to the decision regarding the optimal management strategy, or whether they are of limited importance. If the guideline panel thinks that a particular outcome is important, then it should consider whether the outcome is critical to the decision, or only important, but not critical. To facilitate ranking of outcomes according to their importance guideline developers as well as authors of systematic reviews may choose to rate outcomes numerically on a 1 to 9 scale (7 to 9 – critical; 4 to 6 – important; 1 to 3 – of limited importance) to distinguish between importance categories.
For each recommendations GRADE proposes to limit the number of outcomes to a maximum of 7.

3.2. Perspective of outcomes
Different audiences are likely to have different perspectives on the importance of outcomes.
The importance of outcomes is likely to vary within and across cultures or when considered from the perspective of patients, clinicians or policy-makers. It is essential to take cultural diversity into account when deciding on relative importance of outcomes, particularly when developing recommendations for an international audience. Guideline panels should also decide what perspective they are taking. Guideline panels may also choose to take the perspective of the society as a whole (e.g. a guideline panel developing recommendations about pharmacological management of bacterial sinusitis may take the patient perspective when considering health outcomes, but also a society perspective when considering antimicrobial resistance to specific drugs).
3.3. Before and after literature review
For a guideline, an initial rating of the importance of outcomes should precede the review of the evidence, and this rating should be confirmed or revised following the evidence review.
One should aim to decide which outcomes are important during protocol development and before one undertakes a systematic review or guideline project.
However, rating importance of an outcome prior to evidence review is preliminary: when evidence becomes available a reassessment of importance is necessary.
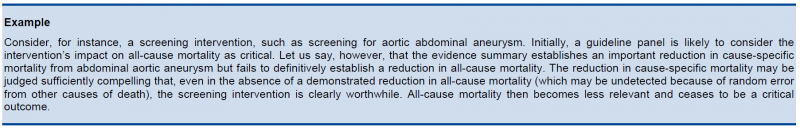
Guideline panels should be aware that in some instances the importance of an outcome may only become known after the protocol is written, evidence is reviewed or the analyses are carried out, and should take appropriate actions to include these in the evidence tables.
Outcomes that are critical to decision making should be included in an evidence table whether or not information about them is available.
3.4. Implications of the classification
Only outcomes considered critical (rated 7—9) or important (rated 4—6) should be included in the evidence profile.
Only outcomes considered critical (rated 7—9) are the primary factors influencing a recommendation and should be used to determine the overall quality of evidence supporting this recommendation.
When determining which outcomes are critical, it is important to bear in mind that absence of evidence on a critical outcome automatically leads to a downgrading of the evidence.
3.5. Expert involvement
Experts and stakeholders should be involved when determining the research questions and important outcomes. At KCE this usually consists of inviting a number of experts in the field to an expert meeting. While interactions between experts often are useful, there is a real danger that unprepared meetings lead to ‘suboptimal’ decisions. The following may make this process easier:
- Try to make them focus on the really important questions, there are usually lots of interesting questions but scope needs to be limited
- Explain on forehand the implications of the term ‘critical outcome’. It is useful to ask the question on beforehand: is the outcome that critical that one is prepared to downgrade the level of evidence if insufficient evidence is found for this particular outcome.
- Make a proposal on beforehand, expert meetings are often too short to construct a complete framework of questions with the relevant outcomes from scratch by the invited experts.
- It may be useful to ask experts on beforehand to provide ratings for the different outcomes (e.g. in an Excel sheet) and ask them to put their justification in writing.
- Try to give an introduction on GRADE so that everybody has an understanding of what it is and what the implications are.
3.6. Use of surrogates
Guideline developers should consider surrogate outcomes only when high-quality evidence regarding important outcomes is lacking. When such evidence is lacking, guideline developers may be tempted to list the surrogates as their measures of outcome. This is not the approach GRADE recommends. Rather, they should specify the important outcomes and the associated surrogates they must use as substitutes. The necessity to substitute with the surrogate may ultimately lead to rating down the quality of the evidence because of indirectness.
3.7. Clinical decision threshold and minimally important difference
When important decisions are made about outcomes, it is also important to consider the minimal clinical importance of an effect size, as this is best decided before the evidence is collected and summarized, in order to avoid subjective and ad hoc decisions influenced by the available evidence.
GRADE uses the term Clinical Decision Threshold, i.e. the threshold that would change the decision whether or not to adopt a clinical action.
For binary outcomes this usually implies a risk reduction. The threshold is likely to differ according to the outcome, e.g. a mortality reduction of 10 % will be more important than a reduction of 10% in the number of patients developing a rash. For continuous outcomes, the minimally important difference is used, i.e. the smallest difference in outcome of interest that informed patients or proxies perceive to be important, either beneficial or harmful, and that would lead the patient or clinician to consider a change in management.
Notes
- A minimally important difference is measured at the individual level.
- The effect on a continuous outcome can be expressed as a mean difference, but also as the proportion of patients having a benefit that is above the minimally important difference.
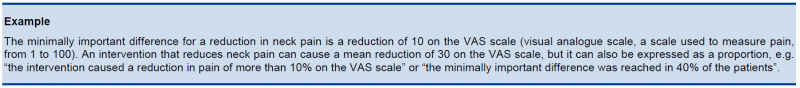
Determining this threshold is not straightforward and often difficult. Expert opinion is often essential.
For a few outcomes validated thresholds exist based on evidence from surveys amongst patients, e.g. the Cochrane back pain group determined a threshold for back and neck pain. Doing a specific literature search on this topic is probably too labour-intensive and moreover, there are no universally accepted and agreed validated methods for doing so. Some rules of thumb are provided by the GRADE working group, such as an increase/decrease of 25%, but one should be cautious to apply these without a critical reflection on the context.
3.8. Adverse effects
Any intervention may be associated with adverse effects that are not initially apparent. Thus, one might consider ‘‘as-yet-undiscovered toxicity’’ as an important adverse consequence of any new drug. Such toxicity becomes critical only when sufficient evidence of its existence emerges.
The tricky part of this judgment is how frequently the adverse event must occur and how plausible the association with the intervention must be before it becomes a critical outcome. For instance, an observational study found a previously unsuspected association between sulfonylurea use and cancer-related mortality. Should cancer deaths now be an important, or even a critical, endpoint when considering sulfonylurea use in patients with type 2 diabetes? As is repeatedly the case, we cannot offer hard and fast rules for these judgments.
4. Summarizing the evidence
Evidence must be summarized with results ideally coming from optimally conducted systematic reviews for each patient-important outcome. For each comparison of alternative management strategies, all outcomes should be presented together. It is likely that all studies relevant to a healthcare question will not provide evidence regarding every outcome. The GRADE working group has developed specific approaches to present the quality of the available evidence, the judgments that bear on the quality rating, and the effects of alternative management strategies on the outcomes of interest: the GRADE evidence profile (EP) and the Summary of Findings (SoF) table. An evidence profile is more detailed than a summary of findings table. The main difference is that it provides the detailed judgments and reasons for down- or upgrading per category (see below). As such, an evidence profile provides the information for other guideline developers and validators that allows them to understand how the judgment about the level of evidence was reached.
The GRADEpro software facilitates the process of developing both EPs and SoF tables.
The SoF table consists of 7 elements:
- A list of all important outcomes, both desirable and undesirable;
- A measure of the typical burden of these outcomes (e.g. control group, estimated risk);
- A measure of the risk in the intervention group or, alternatively or additionally, a measure of the difference between the risks with and without intervention;
- The relative magnitude of effect;
- Numbers of participants and studies addressing these outcomes;
- A rating of the overall confidence in effect estimates for each outcome (which may vary by outcome);
- Comments.
For binary outcomes, relative risks (RRs) are the preferred measure of relative effect and, in most instances, are applied to the baseline or control group risks to generate absolute risks. Ideally, the baseline risks come from observational studies including representative patients and identifying easily measured prognostic factors that define groups at differing risk. In the absence of such studies, relevant randomized trials provide estimates of baseline risk. When confidence intervals (CI) around the relative effect include no difference, one may simply state in the absolute risk column that results fail to show a difference, omit the point estimate and report only the CIs, or add a comment emphasizing the uncertainty associated with the point estimate.
On top of that GRADE provides a number of supplementary recommendations:
- A SoF table should present the seven (or fewer) most important outcomes. These outcomes must always be patient-important outcomes and never be surrogates, although surrogates can be used to estimate effects on patient-important outcomes;
- A SoF table should present the highest quality evidence;
- When quality of two bodies of evidence (e.g. randomized trials and observational studies) is similar, a SoF table may include summaries from both.
5. Rating the quality of evidence
5.1. Introduction
GRADE specifies four quality categories (high, moderate, low, and very low) that are applied to a body of evidence, but not to individual studies. In the context of a systematic review, quality reflects our confidence that the effect estimates are correct. In the context of recommendations, quality reflects our confidence that the effect estimates are adequate to support a particular recommendation.
Guideline panels have to determine the overall quality of evidence across all the critical outcomes essential to a recommendation they make. Guideline panels usually provide a single grade of quality of evidence for every recommendation, but the strength of a recommendation usually depends on evidence regarding not just one, but a number of patient-important outcomes and on the quality of evidence for each of these outcomes.
When determining the overall quality of evidence across outcomes:
- Consider only those outcomes that are deemed critical;
- If the quality of evidence differs across critical outcomes and outcomes point in different directions — towards benefit and towards harm — the lowest quality of evidence for any of the critical outcomes determines the overall quality of evidence;
- If all outcomes point in the same direction — towards either benefit or harm — the highest quality of evidence for a critical outcome, that by itself would suffice to recommend an intervention, determines the overall quality of evidence. However, if the balance of the benefits and harms is uncertain, the grade of the critical outcome with the lowest quality grading should be assigned.
5.1.1. Four levels of evidence
Randomized trials start as high-quality evidence, observational studies as low quality (see table). ‘‘Quality’’ as used in GRADE means more than risk of bias and may also be compromised by imprecision, inconsistency, indirectness of study results, and publication bias. In addition, several factors can increase our confidence in an estimate of effect. This general approach is summarized in the table below.


In the following chapters these factors will be discussed in depth. However, it is important to emphasize again that GRADE warns against applying this upgrading and downgrading in a too mechanistic way and to leave room for judgment.
Although GRADE suggests the initial separate consideration of five categories for rating down the quality of evidence and three categories for rating up, with a yes/no decision in each case, the final rating of overall evidence quality occurs in a continuum of confidence in the validity, precision, consistency, and applicability of the estimates. Fundamentally, the assessment of evidence quality remains a subjective process, and GRADE should not be seen as obviating the need for or minimizing the importance of judgment. As repeatedly stressed, the use of GRADE will not guarantee consistency in assessment, whether it is of the quality of evidence or of the strength of recommendation. There will be cases in which competent reviewers will have honest and legitimate disagreement about the interpretation of evidence. In such cases, the merit of GRADE is that it provides a framework that guides one through the critical components of this assessment and an approach to analysis and communication that encourages transparency and an explicit accounting of the judgments involved.
5.1.2. Overall quality of evidence
Guideline panels have to determine the overall quality of evidence across all the critical outcomes essential to a recommendation they make. Guideline panels usually provide a single grade of quality of evidence for every recommendation, but the strength of a recommendation usually depends on evidence regarding not just one, but a number of patient-important outcomes and on the quality of evidence for each of these outcomes.
When determining the overall quality of evidence across outcomes:
- Consider only those outcomes that are deemed critical;
- If the quality of evidence differs across critical outcomes and outcomes point in different directions — towards benefit and towards harm — the lowest quality of evidence for any of the critical outcomes determines the overall quality of evidence;
- All outcomes point in the same direction — towards either benefit or harm — the highest quality of evidence for a critical outcome that by itself would suffice to recommend an intervention determines the overall quality of evidence. However, if the balance of the benefits and downsides is uncertain, then the grade of the critical outcome with the lowest quality grading should be assigned.
5.1.3. GRADE and meta-analysis
GRADE relies on the judgment about our confidence in a (beneficial or adverse) effect of an intervention and therefore it is impossible to apply GRADE correctly if a meta-analysis is not at least considered and the necessary judgments are made on (statistical, methodological and clinical) heterogeneity. It is possible that no pooled effect can or should be calculated if there is evidence of heterogeneity, be it clinical, methodological or merely statistical, but meta-analysis should always be attempted. Otherwise, it is impossible to gather sufficient elements to make the necessary GRADE judgments. Note that heterogeneity is in most cases a reason to downgrade the body of evidence, with some exceptions that will be explained later.
In order to apply GRADE (but actually in order to make a sound judgment on evidence in general) it is essential that at least one person implicated in the development of the guideline understands this guidance and is able to apply it.
GRADE remains rather vague about what to do if only one study is available. We recommend to downgrade the evidence with at least one level, except when the single study is a multicentre study where sample size in the individual centres is sufficient to demonstrate heterogeneity if there is any. Any decision not to downgrade must be explained and justified.
If the primary studies do not allow the calculation of a confidence interval, consider downgrading as judging precision and heterogeneitiy becomes difficult. There are some rare exceptions, when the confidence interval is not needed as all studies point clearly in the same direction. In some cases non-parametric tests are used because the assumption of normality is violated. In these case, the non-parametric measure of uncertainty should be used (most of the time an interquartile range) and interpreted. Decisions taken around these issues should be justified.
5.2. Study limitations, risk of bias
5.2.1. Risk of bias assessment of individual studies should be done using a validated assessment tool
For the quality assessment of individual studies, specific tools were selected by the KCE.
There is no agreed KCE tool for observational studies. At this moment, we limit ourselves to a number of elements that need to be verified when looking at observational studies. There are a large number of assessment tools, but in the scientific community there is considerable disagreement on what items really matter. Moreover, observational studies are way more diverse then RCTs.
Study limitations in observational studies as identified by GRADE are:
- Failure to develop and apply appropriate eligibility criteria (inclusion of control population);
- Under- or overmatching in case-control studies;
- Selection of exposed and unexposed in cohort studies from different populations;
- Flawed measurement of both exposure and outcome;
- Differences in measurement of exposure (e.g., recall bias in case-control studies);
- Differential surveillance for outcome in exposed and unexposed in cohort studies;
- Failure to adequately control confounding;
- Failure of accurate measurement of all known prognostic factors;
- Failure to match for prognostic factors and/or lack of adjustment in statistical analysis;
- Incomplete follow-up.
5.2.2. Moving from individual risk of bias to a judgment about rating down for risk of bias across a body of evidence
Moving from risk of bias criteria for each individual study to a judgment about rating down for risk of bias across a group of studies addressing a particular outcome presents challenges. GRADE suggests the following principles:
- First, in deciding on the overall quality of evidence, one does not average across studies (for instance if some studies have no serious limitations, some serious limitations, and some very serious limitations, one does not automatically rate quality down by one level because of an average rating of serious limitations). Rather, judicious consideration of the contribution of each study, with a general guide to focus on the high-quality studies, is warranted.
- Second, this judicious consideration requires evaluating the extent to which each trial contributes toward the estimate of magnitude of effect. This contribution will usually reflect study sample size and number of outcome events: larger trials with many events will contribute more, much larger trials with many more events will contribute much more.
- Third, one should be conservative in the judgment of rating down. That is, one should be confident that there is substantial risk of bias across most of the body of available evidence before one rates down for risk of bias.
- Fourth, the risk of bias should be considered in the context of other limitations. If, for instance, reviewers find themselves in a close-call situation with respect to two quality issues (risk of bias and, e.g. precision), we suggest rating down for at least one of the two.
- Fifth, notwithstanding the first four principles, reviewers will face close-call situations. They should both acknowledge that they are in such a situation, make it explicit why they think this is the case, and make the reasons for their ultimate judgment apparent.
This approach is summarized in the table below.

5.3. Inconsistency
Widely differing estimates of the treatment effect (i.e. heterogeneity or variability in results) across studies suggest true differences in underlying treatment effect. When heterogeneity exists, but investigators fail to identify a plausible explanation, the quality of evidence should be downgraded by one or two levels, depending on the magnitude of the inconsistency in the results.
Inconsistency may arise from differences in:
- Populations (e.g. drugs may have larger relative effects in sicker populations);
- Interventions (e.g. larger effects with higher drug doses);
- Outcomes (e.g. diminishing treatment effect with time).
Guideline panels or authors of systematic reviews should also consider the extent to which they are uncertain about the underlying effect due to the inconsistency in results and they may downgrade the quality rating by one or even two levels.
GRADE suggests rating down the quality of evidence if large inconsistency (heterogeneity) in study results remains after exploration of a priori hypotheses that might explain heterogeneity.
5.3.1. Heterogeneity and inconsistency
GRADE uses inconsistency and heterogeneity rather interchangeably. However, there are some important nuances:
- A heterogeneity in effect – where it can be assumed that it is randomly distributed – may be due to random variation in the effect amongst studies. To properly address this, the pooled effect should be calculated using random modelling (RevMan uses the DerSimonian and Laird random effects model, but other techniques, such as Bayesian and maximum likelihood, are often used as well). An important condition for the use of these techniques is that it must be plausible that the heterogeneous effect is randomly distributed, which is not always easy to verify. DerSimonian, Laird and maximum likelihood methods have an additional assumption that the effect is normally distributed, while with Bayesian techniques another distribution can be used as well. The studies in this case cannot be considered as inconsistent, and the heterogeneity is accounted for here by the larger confidence interval, so no downgrading is needed here. Note that if the heterogeneity statistic Q is less than or equal to its degrees of freedom (so if I² = 0), DerSimonian gives results that are numerically identical to the (non random effects) inverse variance method.
- If heterogeneity is important for one reason or another, but all estimates point in the same direction, e.g. a strong or very strong effect of the intervention, then one should not necessary downgrade for inconsistency but make a judgement on the plausibility of the study results.
5.3.2. Judging heterogeneity and inconsistency
Exploring and judging heterogeneity is probably the most difficult part in performing and judging a meta-analysis. A number of rules are presented, but a full explanation can be found in the Cochrane Handbook (chapters 9.5 and 9.6). A KCE expert exploring and judging heterogeneity should at least have a good understanding of and ability to apply this Cochrane guidance. If not, he/she should ask for help from somebody who does.
GRADE identifies four criteria for assessing inconsistency in results, and reviewers should consider rating down for inconsistency when:
- Point estimates vary widely across studies;
- Confidence intervals (CIs) show minimal or no overlap;
- The statistical test for heterogeneity which tests the null hypothesis that all studies in a meta-analysis have the same underlying magnitude of effect shows a low p-value;
- The I², which quantifies the proportion of the variation in point estimates due to between-study differences, is large
In the past, rigid criteria were used to judge heterogeneity, e.g. an I² of 50% used to be a common threshold. This improves the consistency in judgments, but one risks to be consistently wrong. All statistical approaches have their limitations, and their results should be seen in the context of a subjective examination of the variability in point estimates and the overlap in CIs. So again, transparent judgments are essential here.
What is a large I²? One set of criteria would say that an I² of less than 40% is low, 30 to 60% may be moderate, 50 to 90% may be substantial, and 75 to 100% is considerable. Note the overlapping ranges and the equivocation (‘‘may be’’): an implicit acknowledgment that the thresholds are both arbitrary and uncertain. When individual study sample sizes are small, point estimates may vary substantially, but because variation may be explained by chance, I² may be low. Conversely, when study sample size is large, a relatively small difference in point estimates can yield a large I².
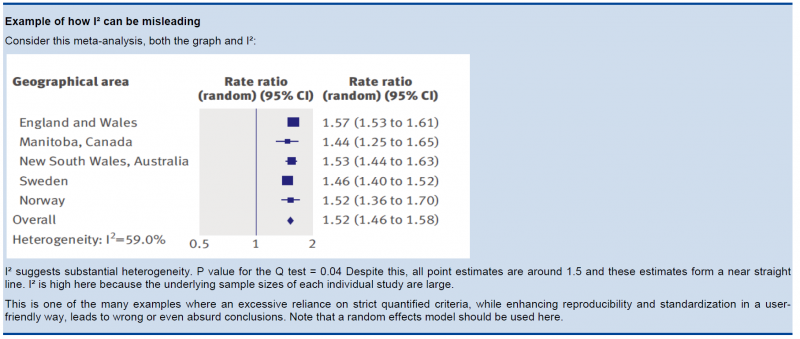
5.3.3. Other considerations
- Risk differences (i.e. absolute risk reductions) in subpopulations tend to vary widely. Relative risk (RR) reductions, on the other hand, tend to be similar across subgroups, even if subgroups have substantial differences in baseline risk. GRADE considers the issue of difference in absolute effect in subgroups of patients, much more common than differences in relative effect, as a separate issue. When easily identifiable patient characteristics confidently permit classifying patients into subpopulations at appreciably different risk, absolute differences in outcome between intervention and control groups will differ substantially between these subpopulations. This may well warrant differences in recommendations across subpopulations.
- Rate down for inconsistency, not up for consistency.
- Even when there is heterogeneity in effect, one must evaluate if the heterogeneity affects your judgment on clinical effectiveness, e.g. when there are large differences in the effect size, but when the estimations point to the same direction (all beneficial or all harmful).
- Reviewers should combine results only if – across the range of patients, interventions, and outcomes considered – it is plausible that the underlying magnitude of treatment effect is similar. This decision is a matter of judgment. Magnitude of intervention effects may differ across studies, due to the population (e.g. disease severity), the interventions (e.g. doses, co-interventions, comparison of interventions), the outcomes (e.g. duration of follow-up), or the study methods (e.g. randomized trials with higher and lower risk of bias). If one of the first three categories provides the explanation, review authors should offer different estimates across patient groups, interventions, or outcomes. Guideline panelists are then likely to offer different recommendations for different patient groups and interventions. If study methods provide a compelling explanation for differences in results between studies, then authors should consider focusing on effect estimates from studies with a lower risk of bias.
Beware of subgroup analyses. The warning below originates from the Cochrane Handbook (chapter 9.6). When confronted with this, consult at least a second opinion of a knowledgeable person.
Subgroup analyses involve splitting all the participant data into subgroups, often so as to make comparisons between them. Subgroup analyses may be done for subsets of participants (such as males and females), or for subsets of studies (such as different geographical locations). Subgroup analyses may be done as a means of investigating heterogeneous results, or to answer specific questions about particular patient groups, types of intervention or types of study. Findings from multiple subgroup analyses may be misleading. Subgroup analyses are observational by nature and are not based on randomized comparisons (an exception is when randomisation is stratified within these subgroups). False negative and false positive significance tests increase in likelihood rapidly as more subgroup analyses are performed (this is due to the multiple testing problem: if you perform a significant test frequently enough, you are likely to find by chance a statistically significant result). If findings are presented as definitive conclusions, there is clearly a risk of patients being denied an effective intervention or treated with an ineffective (or even harmful) intervention. Subgroup analyses can also generate misleading recommendations about directions for future research that, if followed, would waste scarce resources.
5.4. Indirectness
Direct evidence comes from research that directly compares the interventions in which we are interested when applied to the populations in which we are interested and measures outcomes important to patients. Evidence can be indirect in one of four ways:
- First, patients may differ from those of interest (the term applicability is often used for this form of indirectness).
- Secondly, the intervention tested may differ from the intervention of interest. Decisions regarding indirectness of patients and interventions depend on an understanding of whether biological or social factors are sufficiently different that one might expect substantial differences in the magnitude of effect.
- Thirdly, outcomes may differ from those of primary interest, for instance, surrogate outcomes that are not themselves important, but measured in the presumption that changes in the surrogate reflect changes in an outcome important to patients.
- A fourth type of indirectness, conceptually different from the first three, occurs when clinicians must choose between interventions that have not been tested in head-to-head comparisons. Making comparisons between treatments under these circumstances requires specific statistical methods and will be rated down in quality one or two levels depending on the extent of differences between the patient populations, co-interventions, measurements of the outcome, and the methods of the trials of the candidate interventions.
5.5. Imprecision
GRADE suggests that examination of 95% confidence intervals (CIs) provides the optimal primary approach to decisions regarding imprecision. Results are considered imprecise when studies include relatively few patients and few events and thus have wide confidence intervals around the estimate of the effect. In this case a guideline panel will judge the quality of the evidence lower than it otherwise would because of resulting uncertainty in the results.
As a general principle GRADE recommends to consider the rating down for imprecision If a recommendation or clinical course of action would differ if the upper versus the lower boundary of the CI represented the truth. In order to judge this the clinical decision threshold needs to be defined. We explain the situation for both categorical and continuous outcomes.
5.5.1. Clinical decision threshold and minimally important difference
5.5.1.1. Categorical outcomes
As we explained before, it is good to discuss the clinical decision threshold and try to determine them on beforehand. However, one must be careful not to apply this in a too mechanical way, as you need also to take into account the downsides of the intervention, such as side effect or morbidity induced by the intervention, on which in a lot of cases you have only information after collecting the evidence. If it is not possible to determine a threshold, then GRADE suggests to use a RRR or RRI greater than 25%. This 25% threshold is a good and pragmatic starting point, but other factors should be taken into account as well, such as the absolute risk reduction.
5.5.1.2. Continuous outcomes
If the 95%CI upper or lower CI crosses the minimally important difference (MID), either for benefit of harm.
Note: if the MID is not known or the use of different outcome measures required calculation of an effect size, we suggest downgrading if the upper or lower CI crosses an effect size of 0.5 in either direction.
Effect size (ES):
A generic term for the estimate of effect of treatment for a study. Sometimes, the term is used to refer to the standardized mean difference, the difference between two estimated means divided by an estimate of the standard deviation.
To facilitate the understanding we suggest an interpretation of the effect size offered by Cohen, also known as ‘Cohen’s d’[1]. According to this interpretation, an effect size or SMD of around:
- 0.2 is considered a small effect;
- 0.5 is considered a moderate effect;
- 0.8 or higher is considered a large effect.
There are also other methods to standardise effect sizes, such as Glass ∆ or hedges d, depending on the choice of the estimator of the standard deviation.
[1] (Cohen J. Statistical Power Analysis for the Behavioral Sciences. 2nd ed; 1988).
5.5.2. Application and examples
The concrete application of these rules differs according to the situation. Note that imprecision is judged on all outcomes that are judged critical, so the precision of the estimations of the effects on both harms and benefits need to be evaluated.
- Studies indicate a benefit compared to the alternative so you consider recommending the intervention based on the fact that it is beneficial in a clinically significant way.
In this case you must prove not only that the pooled or best estimate of the effect is different from no effect but that it is better than the clinical decision threshold. So the confidence interval must exclude this threshold.
- Studies indicate a harm compared to the alternative so you consider not recommending the intervention based on the fact that it is harmful in a clinically significant way.
In this case you must prove not only that the pooled or best estimate of the effect is different from no effect but that it is more harmful then the clinical decision threshold. So the confidence interval must exclude this threshold.
- Studies indicate that it is not better than the alternative so you consider not recommending the intervention based on the fact that it is not better in a clinically significant way.
In this case you must prove that the pooled or best estimate of the effect is lower that the clinical decision threshold. So the confidence interval must exclude this threshold.
- Studies indicate that it is not more harmful than the alternative so you consider recommending the intervention based on the fact that it is not more harmful in a clinically significant way.
In this case you must prove that the pooled or best estimate of the effect is lower that the clinical decision threshold. So the confidence interval must exclude this threshold.
The last two situations amount to proving non superiority or non inferiority. If the line of no effect is crossed, this does not play a major role in the decision.
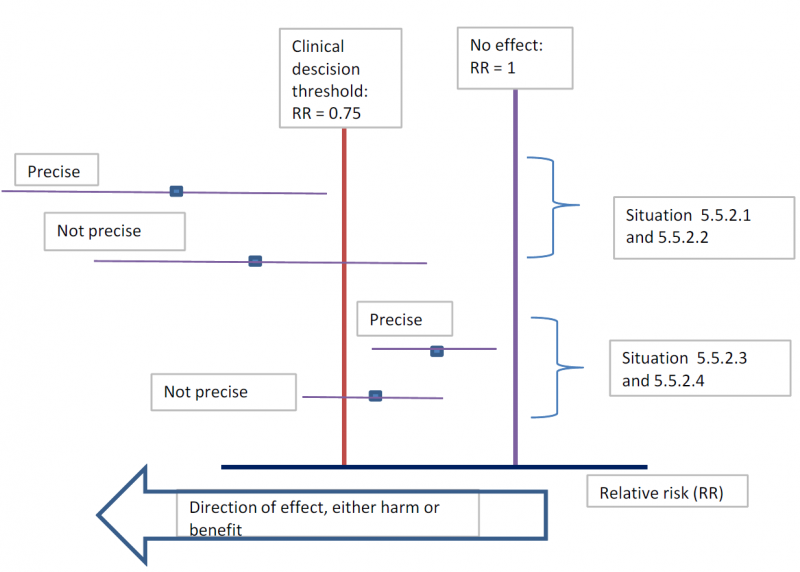
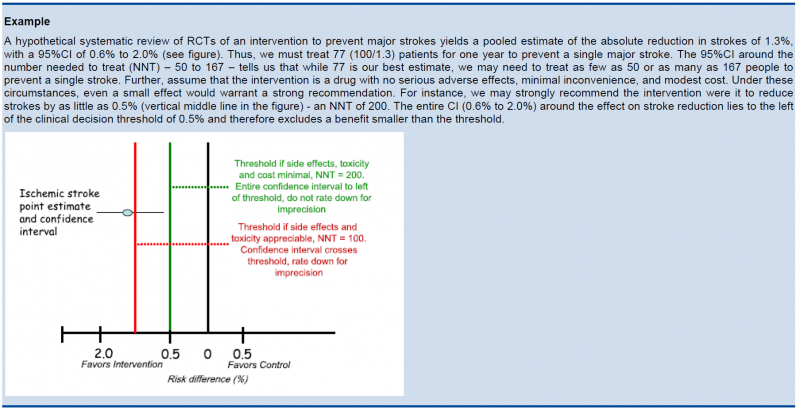
5.5.3. Relative versus absolute reductions
The recommended output of a meta-analysis is a relative risk or odds ratio as they are more stable across different baseline risks, but absolute reductions are more useful for clinical decisions. The valid way of estimating the absolute risk reduction is to multiply the relative risk from the meta-analysis with the most plausible estimate or range of estimates of the baseline risk, this is the risk in the assumed control group, often called the assumed control risk.
Assumed control risk (ACR):
As relative risks are more stable, absolute risk reductions are best calculated applying a relative risk reduction to an assumed control risk. Determining the assumed control risk is not always easy and straightforward. The best estimates usually come from Belgian data, e.g. for cancer the data from the cancer registry are a valuable tool. When not available one can use expert opinion or take the baseline effect from studies in the literature. When different studies exist with varying baseline risk sometimes the median control risk is taken (this is what GRADE pro does by default), but it may be better to report a range of plausible values.
5.5.4. Dealing with fragility: Optimal Information Size (OIS)
The clinical decision threshold criterion is not completely sufficient to deal with issues of precision. The reason is that confidence intervals may appear narrow, but small numbers of events may render the results fragile.
The reasoning above suggests the need for, in addition to CIs, another criterion for adequate precision. GRADE suggests the following: if the total number of patients included in a systematic review is less than the number of patients generated by a conventional sample size calculation for a single adequately powered trial, consider the rating down for imprecision. Authors have referred to this threshold as the “optimal information size” (OIS). Many online calculators for sample size calculation are available, you can find one simple one at http://www.stat.ubc.ca/∼rollin/stats/ssize/b2.html.
As an alternative to calculating the OIS, review and guideline authors can also consult a figure to determine the OIS. The figure presents the required sample size (assuming α of 0.05, and β of 0.2) for RRR of 20%, 25%, and 30% across varying control event rates. For example, if the best estimate of control event rate was 0.2 and one specifies an RRR of 25%, the OIS is approximately 2 000 patients.
The choice of RRR is a matter of judgment. The GRADE handbook suggested using RRRs of 20% to 30% for calculating the OIS, but there may be instances in which compelling prior information would suggest choosing a larger value for the RRR for the OIS calculation.
Beware, however, not to base your sample size on the RRR of minimally clinical importance, a practice that is suitable for sample size calculations when you set up studies, but not for judging fragility, because it leads to paradoxes: if expected effects are considerably larger than what is clinically important because the clinically important effect is small (e.g. a small effect on mortality in children would be considered important), you would risk to downgrade without good reasons because the required sample size would be too large. Note that the OIS helps judging the stability of the CIs, and not if the study was large enough to detect a difference.

Power is, however, more closely related to number of events than to sample size. The figure presents the same relationships using total number of events across all studies in both treatment and control groups instead of total number of patients. Using the same choices as in the prior paragraph (control event rate 0.2 and RRR 25%), one requires approximately 325 events to meet OIS criteria.

Calculating the OIS for continuous variables requires specifying:
- probability of detecting a false effect – type I error (α; usually 0.05)
- probability of detecting a true effect – power (usually 80% [power = 1 – type II error; β; usually 0.20])
- realistic difference in means (Δ)
- appropriate standard deviation (SD) from one of the relevant studies (we suggest the median of the available trials or the rate from a dominating trial, if it exists).
For continuous variables we should downgrade when total population size is less than 400 (a threshold rule-of-thumb value; using the usual α and β, and an effect size of 0.2 SD, representing a small effect). In general an number of events of more then 400 guarantees the stability of a confidence interval.
5.5.5. Low event rates with large sample size: an exception to the need for OIS
In the criteria we have offered so far, our focus has been on relative effects. When event rates are very low, CIs around relative effects may be wide, but if sample sizes are sufficiently large, it is likely that prognostic balance has indeed been achieved, and rating down for imprecision becomes inappropriate. 
The decision regarding the magnitude of effect that would be important is a matter of judgment. When control rates are sufficiently low, CIs around relative effects can appear very wide, but CIs around absolute effects will nevertheless be narrow. Thus, although one would intuitively rate down for imprecision considering only the CI around the relative effect, consideration of the CI around the absolute effect may lead to an appropriate conclusion that precision is adequate. Note that the inference of unimportance requires a low incidence of events over the desirable duration of follow-up; short follow-up will generate a low incidence of events that may be misleading.
5.6. Publication bias
Publication bias is a systematic underestimate or an overestimate of the underlying beneficial or harmful effect due to the selective publication of studies. Publication bias arises when investigators fail to report studies they have undertaken (typically those that show no effect). Authors should suspect publication bias when available evidence comes from a number of small studies, most of which have been commercially funded.
A number of approaches based on the examination of the pattern of data are available to help assess publication bias. The most popular of these is the funnel plot. All, however, have substantial limitations and authors of reviews and guideline panels must often guess about the likelihood of publication bias. Again, there is no substitute for judgment.
Note that selective reporting of outcomes should be dealt with in the assessment of the individual studies.
Guideline panels or authors of systematic reviews should consider the extent to which they are uncertain about the magnitude of the effect due to selective publication of studies and they may downgrade the quality of evidence by one or even two levels. As there are no validated decision rules to do so it is important to provide a narrative justification of the final decision on this issue after consultation of the experts.
Trials registries are in principle compulsory now and can play a major role in detecting selective reporting.
5.7. Reasons to upgrade studies
Observational studies are by default considered low level of evidence. However, the level of evidence can be upgraded for a number of reasons. an important general remark on this issue: only studies with no threats to validity (not downgraded for any reason) can be upgraded. RCT evidence can in principle be upgraded, but GRADE considers this as rare and exceptional.
5.7.1. Large magnitude of effect
When methodologically strong observational studies yield large or very large and consistent estimates of the magnitude of a treatment or exposure effect, we may be confident about the results. In these situations, the weak study design is unlikely to explain all of the apparent benefit or harm, even though observational studies are likely to provide an overestimate of the true effect.
The larger the magnitude of effect, the stronger becomes the evidence. As a rule of thumb, the following criteria were proposed by GRADE:
- Large, i.e. RR >2 or <0.5 (based on consistent evidence from at least 2 studies, with no plausible confounders): upgrade 1 level
- Very large, i.e. RR >5 or <0.2 (based on direct evidence with no major threats to validity): upgrade 2 levels
5.7.2. All plausible confounders
On occasion, all plausible confounding from observational studies or randomized trials may be working to reduce the demonstrated effect or increase the effect if no effect was observed.
For example, if only sicker patients receive an experimental intervention or exposure, yet they still fare better, it is likely that the actual intervention or exposure effect in less sick patients is larger than the data suggest.
5.7.3. Dose-response gradient
The presence of a dose-response gradient may increase our confidence in the findings of observational studies and thereby increase the quality of evidence.
6. Recommendations
The strength of a recommendation reflects the extent to which a guideline panel is confident that desirable effects of an intervention outweigh undesirable effects, or vice versa, across the range of patients for whom the recommendation is intended. GRADE specifies only two categories of the strength of a recommendation. While GRADE suggests using the terms strong and weak recommendations, those making recommendations may choose different wording to characterize the two categories of strength.
For a guideline panel or others making recommendations to offer a strong recommendation, they have to be certain about the various factors that influence the strength of a recommendation. The panel also should have the relevant information at hand that supports a clear balance towards either the desirable effects of an intervention (to recommend an action) or undesirable effects (to recommend against an action). A strong recommendation is one for which the guideline panel is confident that the desirable effects of an intervention outweigh its undesirable effects (strong recommendation for an intervention) or that the undesirable effects of an intervention outweigh its desirable effects (strong recommendation against an intervention). A strong recommendation implies, that most or all individuals will be best served by the recommended course of action.
When a guideline panel is uncertain whether the balance is clear or when the relevant information about the various factors that influence the strength of a recommendation is not available, a guideline panel should be more cautious and in most instances it would opt to make a weak recommendation. A weak recommendation is one for which the desirable effects probably outweigh the undesirable effects (weak recommendation for an intervention) or undesirable effects probably outweigh the desirable effects (weak recommendation against an intervention) but appreciable uncertainty exists. A weak recommendation implies, that not all individuals will be best served by the recommended course of action. There is a need to consider more carefully than usual individual patient’s circumstances, preferences, and values.
6.1. Four key factors influence the strength of a recommendation
- Balance between desirable and undesirable effects (not considering costs)
The larger the difference between the desirable and undesirable consequences, the more likely a strong recommendation is warranted. The smaller the net benefit and the lower the certainty for that benefit, the more likely a weak recommendation is warranted.
- Quality of the evidence
The higher the quality of evidence, the more likely is a strong recommendation.
- Values and preferences
The greater the variability in values and preferences, or uncertainty in values and preferences, the more likely a weak recommendation is warranted.
- Costs (resource utilization)
The higher the costs of an intervention – that is, the more resources are consumed – the less likely a strong recommendation is warranted.
6.2. Wording of a recommendation
Wording of a recommendation should offer clinicians as many indicators as possible for understanding and interpreting the strength of recommendations:
- For strong recommendations, the GRADE working group has suggested adopting terminology, such as "we recommend..." or "clinicians should...".
- For weak recommendations, the GRADE working group has suggested less definitive wording, such as "we suggest..." or "clinicians might...".
Whatever terminology guideline panels use to communicate the dichotomous nature of a recommendation, it is essential that they inform their users what the terms imply. Guideline panels should describe patients or populations (characterized by the disease and other identifying factors) for whom the recommendation is intended and a recommended intervention as specifically and detailed as possible.
Wording strong and weak recommendations is particularly important when guidelines are developed by international organizations and/or are intended for patients and clinicians in different regions, cultures, traditions, and usage of language. It is also crucial to explicitly and precisely consider wording when translating recommendations into different languages.
It is important to adapt the wording of the recommendation to the available evidence. Absence of a statistically significant effect is no proof that an intervention does not work. It is only proven that an intervention doesn’t work if the confidence interval around the effect estimation excludes a minimally important difference or decision threshold.
7. GRADE and diagnostic testing
The GRADE system can be used to grade the quality of evidence and strength of recommendations for diagnostic tests or strategies. There are still a number of limitations and problems that are not entirely solved yet. However, there are some informative publications coming from the GRADE working group on this topic to guide authors of systematic reviews and guideline developers using GRADE to assess the quality of a body of evidence from diagnostic test accuracy (DTA) studies (Schünemann 2008, Brozek 2009, Hsu 2011, Schünemann 2016). People from the GRADE working group continue to publish on GRADE for diagnostic testing, see for example Journal of Clinical Epidemiology Volume 92 (December 2017) .
| Attachment | Size |
|---|---|
| GRADE_for_Diagnosis_KCE_guidance_final2_20171220.pdf | 742.06 KB |
RAPID REVIEWS
See the attached document.
Table of Content
- WHAT IS A RAPID REVIEW?
- WHY ARE RAPID REVIEWS NEEDED?
- DO WE HAVE EVIDENCE THAT RAPID REVIEWS ARE VALID?
- HOW TO PRODUCE RAPID REVIEWS AT KCE?
- SCOPE
- COMPREHENSIVENESS
- Limit the search strategy
- Using a published systematic review as the core document
- Limit textual analysis
- QUALITY CONTROL
- Only one reviewer for title/abstract screening and data extraction
- Limit or eliminate internal or external review of final product (e.g. peer review)
- TRANSPARENT REPORTING
- CONCLUSIONS
| Attachment | Size |
|---|---|
| Rapid_Review_2.pdf | 214.97 KB |
APPENDICES
APPENDIX 1: EXAMPLE OF PICO
Choice β blocker
A patient diagnosed with hypertension and admitted for a laparoscopic knee surgery, asks you whether Tenormin, the antihypertensive drug he is taking, is better than Selozok, the one his neighbour is taking.
| Patient / population | patient with hypertension |
| Intervention | atenolol |
| Comparison | metoprolol |
| Outcomes | (cardiovascular) mortality |
APPENDIX 2: KCE selection of special queries
How to use this file
Depending on your needs, choose the appropriate type of filter (SR or RCT). Then use the filter from the most sensitive to the more specific. In other words, if the most sensitive gives you too much results, use a more specific.
Combine the last line using a AND with the results’ set you want to filter.
Systematic reviews
Medline (OVID)
limit # to systematic reviews
Where # is the line number
This limit will run a query based on the search strategy developed by PubMed.
Embase (Embase.com)
'meta-analysis'/exp OR 'meta-analysis' OR 'systematic review'/exp OR 'systematic review'
This query is adapted from Wilczynski
Randomized Control Trials (RCT)
Medline (OVID)
All queries are adapted from the Cochrane Handbook
Sensitive
- randomized controlled trial.pt
- controlled clinical trial.pt
- randomized.ab
- placebo.ab
- drug therapy.fs
- randomly.ab
- trial.ab
- groups.ab
- 1 or 2 or 3 or 4 or 5 or 6 or 7 or 8
- exp animals/ not humans.sh
- 9 not 10
Sensitivity and specificity
- randomized controlled trial.pt
- controlled clinical trial.pt
- randomized.ti,ab
- placebo.ti,ab
- clinical trials as topic.sh
- randomly.ti,ab
- Trial?.ti
- 1 or 2 or 3 or 4 or 5 or 6 or 7
- exp animals/ not humans.sh
- 8 not 9
Embase (Embase.com)
All queries are adapted from Wong
Sensitive
random*:ab,ti or ‘clinical trial’/de or ‘clinical trial’ or ‘health care quality’/exp
Sensitivity and precision
random*:ab,ti OR placebo*:de,ab,ti OR (double NEXT/1 blind*):ab,ti
Notes
- Several sources of Special queries are listed in the KCE library catalogue
- For a definition, see the "Search electronic Databases Glossary"
APPENDIX 3 Exporting references from online databases
All identified references must exported from the online database; first screening (Title and Abstract) will occur at the reference management software (At KCE, the software in use is EndNote).
Export will preferably result in a text file that is saved (and archived) in the project folder (S:\Project Workingspace\2 Research\04 Search for Evidence\1 Search strategy) and then imported into the reference management software.
Below, the suited export format for each database and the related EndNote Import Filter (import filters are available at S:\Endnote X files\Filters for EndNote X).
| Database | Export options | EndNote Import Filter |
| CINAHL (EBSCO) | _KCE-CINAHL(EBSCO).enf | |
| Cochrane Library (Wiley) | _KCE-Cochrane Library(Wiley).enf | |
| DARE (CRD) | _KCE-DARE(CRD).enf | |
| DARE (Cochrane Library) | _KCE-DARE(Wiley-Cochrane Library).enf | |
| ERIC (Proquest) |
|
|
| EconLit (OVID) |
|
_KCE-EconLit(OVID-KCE).enf |
| Embase (Embase.com) |
|
_KCE-Embase(RIS).enf _KCE-Embase(PLAINTEXT).enf |
| HTA database | _KCE-HTAdb(INAHTA).enf | |
| Journals @ OVID | _KCE-journals@ovid-fulltext(OVID).enf | |
| MedLine (OVID) |
|
_KCE-Medline(OVID).enf |
| MedLine (PubMed) |
_KCE-Medline(PubMed-NLM).enf |
|
| NHSEED (CRD) | _KCE-NHSEED(CRD).enf | |
| Nursing @ OVID | _KCE-Nursing_at_OVID.enf | |
| PEDro | _KCE-PEDro.enf | |
| PsycINFO (OVID) |
|
_KCE-PsycINFO(OVID).enf |
| Sociological Abstracts (Proquest) |
|
_KCE-SociologicalAbs(CSA).enf |
APPENDIX 4: SEARCH ELECTRONIC DATABASES GLOSSARY
= A =
Accuracy
Accuracy is the proportion of all articles that are correctly categorized by the search strategy
Source : http://hiru.mcmaster.ca/hiru/HIRU_Hedges_home.aspx
Adjacent
physician adj5 relationship retrieves records that contain the words physician and relationship within five words of each other in either direction.
E.g. physician patient relationship, patient physician relationship, relationship of the physician to the patient, and so on.
Source: OVID help, available from: http://www.ovid.com /site/help/documentation/ospb/en/syntax.htm#operators
AND
 The AND operator lets you retrieve only those records that include all of your search terms. For example, the search “blood pressure AND stroke” retrieves only those records that contain both terms “blood pressure” and “stroke” together in the same record. Results exclude records that do not contain both terms.
Source : OVID help. Available form: http://www.ovid.com/site/help/documentation/ospb/en/syntax.htm#operators
Image source : http://en.wikipedia.org/wiki/File:LogicGates.svg
Approach
- Identify your problem
- Define a structured question
- Find the best evidence
- How valid is the study?
- What are the results?
- How should I apply the results to patient care?
Source: Guyatt G, Evidence-Based Medicine Working Group. Users' guides to the medical literature : a manual for evidence-based clinical practice. 2nd ed. New York: McGraw-Hill Medical; 2008.
= B =
Bibliographic indexes
A bibliographic index is an "open-end finding guide to the literature of an academic field or discipline (example: Philosopher's Index), to works of a specific literary form (Biography Index) or published in a specific format (Newspaper Abstracts), or to the analyzed contents of a serial publication (New York Times Index). Indexes of this kind are usually issued in monthly or quarterly paperback supplements, cumulated annually.
Some bibliographic indexes are also published online, in which case they are called bibliographic databases
Source : http://en.wikipedia.org/wiki/Bibliographic_index [visited 2010-09-15]
Bibliographical databases
A bibliographic database is a database of bibliographic records, an organized digital collection of references to published literature, including journal and newspaper articles, conference proceedings, reports, government and legal publications, patents, books, etc. In contrast to library catalogue entries, a large proportion of the bibliographic records in bibliographic databases describe analytics (articles, conference papers, etc.) rather than complete monographs, and they generally contain very rich subject descriptions in the form of keywords, subject classification terms, or abstracts.
A bibliographic database may be general in scope or cover a specific academic discipline. A significant number of bibliographic databases are still proprietary, available by licensing agreement from vendors, or directly from the abstracting and indexing services that create them.
Many bibliographic databases evolve into digital libraries, providing the full-text of the indexed contents. Others converge with non-bibliographic scholarly databases to create more complete disciplinary search engine systems, such as Chemical Abstracts or Entrez
Source : http://en.wikipedia.org/wiki/Bibliographic_database [visited 2010-09-15]
Booleans operators
See : ADJACENT, AND, NEAR, NOT, OR
Broader term
In the hierachy of a thesaurus, relationship between a term and a more generic term.
= C =
Context
Thesauri are multi-hiérarchical: one Heading can be found at several places; each place in the hierarchy of the thesaurus is called a context.
Clinical queries
See: Special queries, Subset
= E =
ECLIPSE
ECLIPSE is useful for management, service or health policy related issues.
|
Expectations : |
This is the improvement or innovation or information that you want to see. |
|
Client group : |
|
|
Location : |
|
|
Impact : |
What is the change in the service which is being looked for? What would constitute success? How is this being measured? |
|
Professionals Involved : |
|
|
Service : |
For which service are you looking for information? |
|
Evaluation : |
|
Source : NHS FIFE LIBRARY SERVICES: Guide to Literature Searching. Available from: http://www.nhsfifelibraries.scot.nhs.uk/publications/litsearching.doc [visited 2010-09-15]
Evidence pyramid
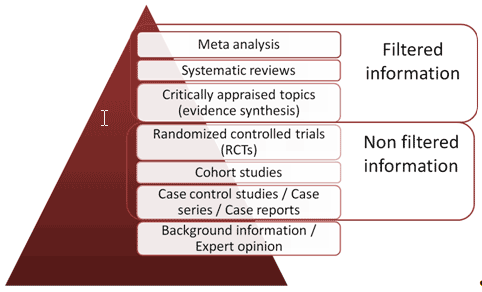
Based on: http://smlweb.aub.edu.lb/Tutorial.aspx?file=Tutorials/principles.html and http://nyu.libguides.com/content.php?pid=27011&sid=234199#systematic [visited 2010-09-15]
Evidence source type
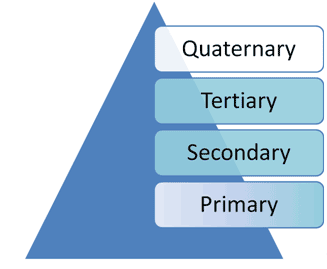
- Quaternary : Clinical guidelines/ consensus meetings/standards
- Tertiary : Systematic reviews/meta-analyses/EBM publications
- Secondary : Bibliographical databases
- Primary : Journals, reports
Source : CEBAM
Explosion (Explode)
Explosion consists of selecting one term in the hierarchy of a thesaurus, and including all narrower terms.
= F =
Focus
Focus consists of selecting a Heading as Major topic. It reduces the amount of results while keeping a good pertinence.
= H =
Hedges
Hedges are special queries developped by HIRU center of the McMaster University (Canada).
See : Special queries
= I =
Institutional repositories
While the main purposes of institutional repositories are to bring together and preserve the intellectual output of a laboratory, department, university, or other entity, the incentives and commitments to change the process of scholarly communication have also begun serving as strong motivators.
Source : http://www.infotoday.com/searcher/may04/drake.shtml [visited 2010-09-15]
= J =
Journal’s impact factor
A journal’s impact factor is based on two elements: the numerator, which is the number of cites in the current year to any items published in the journal in the previous 2 years; and the denominator, the number of substantive articles (source items) published in the same 2 years.
Source: Eugene Garfield. The Agony and the Ecstasy—The History and Meaning of the Journal Impact Factor. International Congress on Peer Review And Biomedical Publication Chicago, September 16, 2005
= M =
Major topics (Medline / MeSH)
Asterisks on MeSH headings and subheadings (e.g., Wound Healing/radiation effects*) designate that they are the major topics of the article, usually obtained from the title and/or statement of purpose
Non-major (non-asterisked) headings and subheadings are usually additional topics substantively discussed within the article, terms added to qualify a major topic (…).
The only indexed MEDLINE citations without an asterisked heading are some biographies in which the subject’s name may be considered the only major point. (…)
Source : http://www.nlm.nih.gov/bsd/disted/mesh/major.html
Mapping
In resources with controlled vocabulary, you can map search terms to subject headings
Source: OVID help. Available form http://www.ovid.com/site/help/documentation/ospb/en/advanced.htm#map
= N =
Narrower term (NT)
In the hierarchy of a thesaurus, relationship between a term and a more specific term
NEAR
Physician NEAR relationship retrieves records that contain the words in the same field
E.g. both words in the Title; in the abstract, and so on
Source : OVID help. Available form: http://www.ovid.com/site/help/documentation/ospb/en/syntax.htm#operators
NOT
 The NOT operator lets you retrieve records that contain your first term but exclude the second term. In this way, you can restrict the scope of your results. For example, the search health reform not health maintenance organizations retrieves only those records that contain the term health reform but exclude the term health maintenance organizations.
Source : OVID help. Available form: http://www.ovid.com/site/help/documentation/ospb/en/syntax.htm#operators
Image source : http://en.wikipedia.org/wiki/File:LogicGates.svg [visited 2010-09-15]
= O =
OAI repositories
See : Institutional repositories
Open Access (OA)
By 'open access' to this literature, we mean its free availability on the public internet, permitting any users to read, download, copy, distribute, print, search, or link to the full texts of these articles, crawl them for indexing, pass them as data to software, or use them for any other lawful purpose, without financial, legal, or technical barriers other than those inseparable from gaining access to the internet itself. The only constraint on reproduction and distribution, and the only role for copyright in this domain, should be to give authors control over the integrity of their work and the right to be properly acknowledged and cited.
Source: http://www.earlham.edu/~peters/fos/boaifaq.htm#openaccess
Open archives initiative (OAI)
The Open Archives Initiative develops and promotes interoperability standards that aim to facilitate the efficient dissemination of content. OAI has its roots in the open access and institutional repository movements. Continued support of this work remains a cornerstone of the Open Archives program. Over time, however, the work of OAI has expanded to promote broad access to digital resources for eScholarship, eLearning, and eScience.
Source : http://www.openarchives.org/
Operators (Booleans)
See : ADJACENT, AND, NEAR, NOT, OR
OR
![]() The OR operator lets you retrieve records that contain any of your search terms. For example, the search “heart attack OR myocardial infarction” retrieves records that contain “heart attack”, “myocardial infarction” or both terms. Results are all inclusive
The OR operator lets you retrieve records that contain any of your search terms. For example, the search “heart attack OR myocardial infarction” retrieves records that contain “heart attack”, “myocardial infarction” or both terms. Results are all inclusive
Source : OVID help. Available form: http://www.ovid.com/site/help/documentation/ospb/en/syntax.htm#operators
Image source : http://en.wikipedia.org/wiki/File:LogicGates.svg
= P =
Permuted index
The Permuted index is an alphabetical list of all entry terms of a thesaurus. The entry term sends to the retained term (Subject Heading).
PICO
PICO is useful for medical questions and for topics where one thing is being compared with another.
|
Patient :. |
This is the “Who”. For this you need to think of age, sex, ethnic origins or other defining characteristics of the patient and the population |
|
Intervention : |
This is also sometimes known as exposure, and makes up the “What”. This is what is happening to the patient or population, so it could be a drug or a therapy, a screening questionnaire or a health improvement programme. |
|
Comparison : |
With what is the intervention (or indeed population) being compared? This could be a control group. |
|
Outcome : |
What outcome do you expect to see? For example, you may be interested in knowing whether an intervention has a health benefit, or whether an exposure results in mortality. |
Source : NHS FIFE LIBRARY SERVICES: Guide to Literature Searching. Available from: http://www.nhsfifelibraries.scot.nhs.uk/publications/litsearching.doc
|
PICO-Timeframe : |
This refers to one or more time-related variables such as the length of time the treatment should be prescribed or the point at which the outcome is measured. |
|
PICOT-T |
Type of study design |
| PICO-Context: | |
| PICO-Setting: |
PIRT
Source:
| P | Population |
| I | Index test |
| R | Reference test |
| T | Target disorer |
Precision
Precision is the proportion of retrieved articles that are of high quality
= Q =
Qualifiers
Qualifiers (subheadings) afford a convenient means of grouping together those citations which are concerned with a particular aspect of a subject. Not every qualifier is suitable for use with every subject heading.
= R =
Related terms (see also)
Associative relationship
Relationships
Thesaurus relationships include Broader terms, Narrower terms, Used for, Use, Related terms / See also
Rotated index
See: Permuted index
= S =
Scope note
A scope note may be a definition. It may include : Including concepts, excluding concepts; Reference to other terms, Additional instructions,
Source : http://publish.uwo.ca/~craven/677/thesaur/main07.htm [visited 2010-09-15]
Search strategy results
Sensitive search
For a sensitive search you need to think of all the possible ways an author or an indexer might describe each of your key words in phrases. You might find it useful to check with a medical thesaurus or a list of subject heading such as MESH (Medical Subject Headings).
The more alternative terms you use the more results you will get from the search.
Source : NHS FIFE LIBRARY SERVICES: Guide to Literature Searching. Available from: http://www.nhsfifelibraries.scot.nhs.uk/publications/litsearching.doc
Sensitivity
Sensitivity for a given strategy is defined as the proportion of high quality articles that are retrieved
Source : http://hiru.mcmaster.ca/hiru/HIRU_Hedges_home.aspx
Special queries
Special queries are pre-established queries allowing to identify pertinent references on a specific subject; two kind of special queries are usually available:
- "Evidence based" special queries that are tested against a gold standard (a manual selection of publications that should be retrieved by the electronic search) regarding sensitivity, specificity, precision and accuracy (e.g. Hedges).
- "Experience based" special queries that are not validated against a gold standard
See Appendix 2 for a KCE selection of special queries
Specific search
For a specific search you want to use only terms that relate directly to your question, so you would use only one (or at the most two) way to describe each search term. You may need to check with the MESH as with the databases own thesaurus to ensure that the terms you are using are the terms the indexer would use.
In a specific search, you would apply more Limits. Limits are search terms such as language, age of article, journal title, article type or limits on the populations such as age, gender, ethnic group etc.
You can limit articles NOT to find certain terms, for example you could search for stress but NOT stress fractures.
The more limits you apply to a search the fewer results you will get from that search.
Source : NHS FIFE LIBRARY SERVICES: Guide to Literature Searching. Available from: http://www.nhsfifelibraries.scot.nhs.uk/publications/litsearching.doc
Specificity
specificity is the proportion of low quality or off topic articles not retrieved.
Source : http://hiru.mcmaster.ca/hiru/HIRU_Hedges_home.aspx
SPICE
SPICE is recognises that information practice is a social science, not a “hard science”, by splitting the population component into both setting and perspective. By replacing “outcomes” with “evaluation” the SPICE model incorporates other concepts such as “outputs” and “impact” together with less tangible effects of an intervention
|
Setting |
Where? |
|
Population |
For whom? |
|
Intervention |
What? |
|
Comparison |
Compared with what? |
|
Evaluation |
With what result? |
Source: Booth A. Clear and present questions: formulating questions for evidence based practice. Library Hi Tech. Vol. 24 No. 3, 2006. pp. 355-368
SPIDER
SPIDER is an alternative search strategy tool for qualitative/mixed methods research
|
Sample |
|
Phenomenon of Interest |
|
Design |
|
Evaluation |
|
Research type |
Structured question
A structured question put together different elements of the same concept (facet).
Examples : ECLIPSE, PICO, PIRT, SPICE, SPIDER
Sub-headings
See : Qualifiers
Subject heading
Subject heading is a word or phrase from a controlled vocabulary which is used to describe the subject of a document or a class of documents.
Source : http://www.iva.dk/bh/lifeboat_ko/concepts/subject_heading.htm
Subset
PubMed subset is the application of a Special query to PubMed records.
Clinical queries search the user’s keyword in a subset of PubMed instead of the whole PubMed set.
E.g.: Systematic Reviews subset on PubMed (source: http://www.nlm.nih.gov/bsd/pubmed_subsets/sysreviews_strategy.html)
= T =
Thesaurus
A thesaurus is a semantic tool used for information retrieval, query expansion and indexing, among other purposes. It is basically a selection of the basic vocabulary in a domain supplemented with information about synonyms, homonyms, generic terms, part/whole terms, “associative terms” and other information (e.g. frequency and history of terms in a given database).
Source : http://www.iva.dk/bh/lifeboat_ko/concepts/thesauri_and_metathesauri.htm
Truncations
Truncated lacking an expected or normal element (as a syllable) at the beginning or end
Source: Meeriam-Webster dictionary. Available from : http://www.merriam-webster.com/dictionar
Examples :
|
Variants |
Economical vs Economics |
Economic* |
0-n |
|
Singular vs Plural |
Stent vs Stents |
Stent? |
0-1 |
|
EN-us vs EN-uk |
Hematology vs Haematology |
H?ematology |
0-1 |
|
Prefixes |
Pre natal vs prenatal vs pre-natal |
Pre?natal |
0-1 |
= U =
Use
In a thesaurus, relationship between a non-descriptor (entre term) and the descriptor which takes its place
Used for (UF)
In a thesaurus, relationship between the descriptor and the non-descriptor(s) or entry terms it represents
APPENDIX 5: SUMMARY OF FINDINGS TABLES
From Oxman, Higgins, and Glasziou (2006)
EXAMPLE:
- Question: Should antibiotics be used for acute otitis media in children?
- Patient or population: Children without tympanostomy tubes, suffering from acute otitis media
- Settings: The included trials were conducted in Europe and North America
Summary of findings
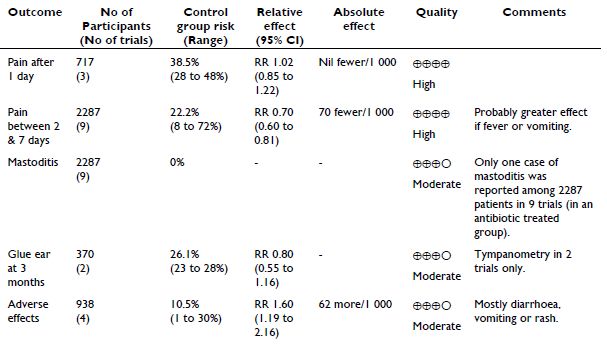
APPENDIX 6: QUALITATIVE DATA
AN EXAMPLE OF A DEBRIEFING TEMPLATE
- Comment le groupe a fonctionné ?
- Contexte environnemental
- Tensions éventuelles
- Problèmes éventuelles avec certaines questions/topic
- Points à approfondir au cours des interviews suivantes
- Premier résultats frappants
AN EXAMPLE OF A QUESTIONNAIRE
Questionnaire used in the KCE research project on citizen and patient participation in reimbursement decision-making (to be published in 2013).
PART 1 – Prior experience and purpose
- Has citizen-patient participation with regard to reimbursement decisions already been discussed in one or several groups?
- At what occasion? When was that? Why was this? Which decision / organ was involved? What type of citizen-patient was involved?
- What were the arguments pro and/or con?
- What was the motivation/background for/of these arguments? Which targets were researched?
- What type of participation was considered? and what type was not considered ? (who, method, decision, …)
- What were or are the conclusions regarding citizen-patient participation?
- Is participation important for the future of our healthcare system or no?
- If no why?
- If yes why? Is it feasible now? What is the high-level goal that could be achieved now and in the future? What are the main obstacles?
- What do you want to attain by including public preferences in health care decision making?
PART 2 – HOW TO INVOLVE
Explanation by interviewer of levels of participation: inform – consult – debate – co-decision – decision
- What level(s) of participation would be most desirable and why?
- What would influence this choice: the subject/type of decision? The moment in the decision-making process?
- For each of these desired levels of intensity, what would be advantages / disadvantages?
- From your knowledge of the different stakeholders, what is feasible now? What is feasible in the Belgian context?
- How should such participation be organised?
- Who could be involved :
- Citizen? Taxpayer? Consumer? Patient? Expert?
- From your experience, what’s the opinion of the stakeholders about the citizen-patient to involve or not to involve ?
- Who would represent the citizen-patient ?
- What would be your ideal scenario to involve the citizen-patient in reimbursement decisions.
PART 3 – EXAMPLES OF PARTICIPATION
- From your experience, can you give examples of participation linked to reimbursement decisions that you know about of have witnessed? If none, is there an example you have been thinking of yourself?
- What was positive or negative about these examples?
[Probe for more than one example. If they are giving foreign examples, we ask them how this could work in Belgium. What would be the same, what would be different.]
Systematic probing questions for all examples the respondent gives:
- what would be better compared to a situation without participation
- what would be negative ?
- how would it work / be organized
- who would be involved (who would represent the citizen-patient)
- what barriers do you see
PART 4 – WRAPPING UP
Based on the choice made, probe again with regard to:
- Type of motivation for participation: democracy, equity, efficiency, …
- Which role do citizen-patient have to take within the decision making process? The user of health services perspective (more particular) or the public policy perspective (more diffuse).
Understand the priorities :
- what would be the most interesting to achieve at mid term? at long term?
- what would be the easiest to get going: the way of lesser resistance?
Closing question when thanking:
- Anything else you would like to say or stress?
AN EXAMPLE OF A TOPIC LIST
The example presented below is fictitious. It could have been used in the KCE research project on refractive eye surgery (in progress), but instead a questionnaire was used.
- Discovery of eye problems
- When?
- How?
- Which solution?
- Reaction?
- Satisfaction with solution. Change to new solution, which one?
- Encounter with eye surgery
- When?
- How?
- Consideration of the eye surgery
- Motivations?
- How far in the process
- Final decision/decision so far
- Planning of the eye surgery
- Experience of the eye surgery and after care
- Emotions – fears
- Practicalities
- Informed consent
- Evaluation of the eye surgery
- Quality of sight
- Pain
- Adverse effects
- Reimbursement of glasses, contact lenses, refractive eye surgery
AN EXAMPLE OF AN INTRODUCTORY TEXT
Bonjour,
Je me présente, je m’appelle [Prénom Nom], je travaille pour [institution] en tant que [décrire sa fonction en essayant de ne pas se positionner comme ‘supérieur’ au(x) répondant(s)], C’est moi qui distribuerai la parole ce soir et modérerai la discussion.
Comme vous le savez, nous réalisons en ce moment un projet relatif au [sujet de l’étude].
Dans ce cadre, nous souhaiterions connaitre les opinion, expériences, sentiments de [description de la population d’étude] quant à [description du sujet de l’étude].
Ce projet est financé/demandé par [bailleur de fonds] avec pour objectif de [objectif de l’étude].
Nous vous avons contacté parce que vous [reprendre les caractéristiques du segment de l’échantillon attendu]. Vous avez été identifié(s) via [source de recrutement].
Notre discussion durera approximativement [fourchette de durée de l’interview/focus group].
Le contenu des discussions et les propos échangées resteront confidentiels. Autrement dit, si certaines phrases seront reprises dans notre rapport final, aucune citation ne reprendra le nom de la personne qui l’a formulée.
(Pour les focus groups) Avant de commencer, je voudrais également vous présenter [Prénom Nom de l’observateur] qui va observer ce groupe afin de voir comment se déroulent les discussions et m’aider éventuellement à distribuer équitablement la parole et garder le temps en vue.
Je vous présente également et [Prénom et Nom du rapporteur] qui prendra note des discussions.
(Pour tous) Je souhaiterais par ailleurs vous demander l’autorisation d’enregistrer l’entretien/les discussions : cela nous permettra de revenir sur vos propos exacts lors de l’analyse de l’ensemble des entretiens, de ne pas déformer vos propos en cas de citation pour illustrer nos résultats et ne pas prendre de notes trop précise pendant l’entretien, ce qui facilitera nos échanges. Si vous/personne n’y voit d’inconvénients, je laisse le dictaphone enregistrer. (celui-ci ayant été enclenché dès le début de l’entretien)
Quelques règles de base : il n’y a pas de bonne ou mauvaise réponse. Les discussions se font dans le respect mutuel de chacun.
(Pour les focus groups) Nous vous remercions de bien vouloir ne pas rapporter ce qui se sera dit ici à l’extérieur du groupe.
Pour ce qui est de la prise de parole, ne parlez pas entre vous, en aparté, mais faites profiter le groupe de vos réflexions. En plus, s’il y a plusieurs conversations en même temps, l’enregistrement en pâtira. Si vous souhaitez prendre la parole, faites-moi un petit signe.
(Pour tous) Vous êtes libre de quitter le groupe/arrêter l’interview à tout moment.
(Pour les focus groups) Avant de passer à la première question, je vous propose de commencer par un tour de table afin de vous présenter en donnant votre prénom et [1 ou 2 caractéristiques en fonction de la question de recherche]. Si vous préférez vous pouvez donner un pseudonyme.
CHECKLIST FOR THE PREPARATION OF FOCUS GROUP INTERVIEWS
|
Research questions of the focus groups |
|
|
Population |
|
|
Segmentation of the participants |
Criteria: FG1: FG2: FG3: FG4: … |
|
Recruiting mode (comfort, snowballing, …) |
decision |
|
Type of interview (directed, half-directed) |
decision |
|
Interview guideline |
- principal question - specific questions - time per question |
|
Test of the guideline |
|
|
Material |
Tape recorder/ numeric recorder Batteries (tape) |
|
Organization of the meetings |
Decide where Decide when Contact people (presentation of the studies, time needed, practical information, … |
OTHER CHECKLISTS AND QUALITY CRITERIA FOR QUALITATIVE RESEARCH
In what follows we will elaborate on two other checklists enabling qualitative researchers to guard the quality of their work.
Henwood and Pidgeon105 identified seven attributes which characterise good qualitative research. Their schema, which links criteria with methods of achieving sound research, offers a helpful guide for novice researchers. They argue for:
- The importance of fit - The themes or analytical categories offered by the researcher should fit the data. The researcher demonstrates this by writing clear, explicit accounts of how these categories were evolved.
- Integration of theory - The researcher needs to discuss the relationship between units of analysis and the degree to which they can be integrated or generalised (for instance, exploring how themes might be combined moving towards a theory).
- Reflexivity – The role of the researcher needs to be acknowledged and accounted for in the documentation of the research.
- Documentation – The researcher needs to provide an audit trail: a comprehensive account of what was done and why.
- Theoretical sampling and negative case analysis – The researcher needs to continuously develop and modify any emerging theory, exploring cases that do not fit as well as those which might generate new knowledge.
- Sensitivity to negotiated realities – While participant validation may be necessary, the researcher needs to demonstrate awareness of the research context, power differentials and participant reactions to the research. It is particularly important to explain any differences between the researcher’s interpretations and those of the participant(s).
- Transferability - The researcher should suggest how the research may have applicability beyond the particular research context.
Malterud106 provides the following checklist:
Aim
- Is the research question a relevant issue?
- Is the aim sufficiently focused, and stated clearly?
- Are the researcher's motives, background, perspectives, and preliminary hypotheses presented, and is the effect of these issues sufficiently dealt with
Method and design
- Are qualitative research methods suitable for exploration of the research question?
- Has the best method been chosen with respect to the research question?
Data collection and sampling
- Is the strategy for data collection clearly stated (usually purposive or theoretical, usually not random or representative)?
- Are the reasons for this choice stated?
- Has the best approach been chosen, in view of the research question?
- Are the consequences of the chosen strategy discussed and compared with other options?
- Are the characteristics of the sample presented in enough depth to understand the study site and context?
Theoretical Framework
- Are the perspectives and ideas used for data interpretation presented?
- Is the framework adequate, in view of the aim of the study?
- Does the author account for the role given to the theoretical framework during analysis?
Analysis
- Are the principles and procedures for data organization and analysis fully described, allowing the reader to understand what happened to the raw material to arrive at the results?
- Were the various categories identified from theory or preconceptions in advance, or were they developed from the data?
- Which principles were followed to organize the presentation of findings?
- Are strategies used to validate results presented, such as cross-checks for rivalling explanations, member checks, or triangulation? If such strategies are not described in this section, they should appear as validity discussion later in the report.
Findings
- Are the findings relevant with respect to the aim of the study?
- Do they provide new insight?
- Is the presentation of the findings well organized and best suited to ensure that findings are drawn from systematic analysis of material, rather than from preconceptions?
- Are quotes used adequately to support and enrich the researcher's synopsis of the patterns identified by systematic analysis?
Discussion
- Are questions about internal validity (what the study is actually about), external validity (to what other settings the findings or notions can be applied), and reflexivity (the effects of the researcher on processes, interpretations, findings, and conclusions) addressed?
- Has the design been scrutinized?
- Are the shortcomings accounted for and discussed, without denying the responsibility for choices taken?
- Have the findings been compared with appropriate theoretical and empirical references?
- Are a few clear consequences of the study proposed?
Presentation
- Is the report easy to understand and clearly contextualized?
- Is it possible to distinguish between the voices of the informants and those of the researcher?
References
- Are important and specific sources in the field covered, and have they been appropriately presented and applied in the text?
COLOPHON
COLOPHON
|
Title: |
|
KCE Process book online |
|
Authors: |
|
|
|
Conflict of interest: |
|
None declared |
|
|
|
|
|
Disclaimer: |
|
The external experts were consulted about a (preliminary) version of the scientific report. Their comments were discussed during meetings. They did not co-author the scientific report and did not necessarily agree with its content. Subsequently, a (final) version was submitted to the validators. The validation of the report results from a consensus or a voting process between the validators. The validators did not co-author the scientific report and did not necessarily all three agree with its content. Finally, this report has been approved Choose an item. by the Executive Board. Only the KCE is responsible for errors or omissions that could persist. The policy recommendations are also under the full responsibility of the KCE. |
|
|
|
|
|
Publication date: |
|
Click here to enter a date. |
|
Domain: |
|
Choose an item. |
|
MeSH: |
|
|
|
NLM Classification: |
|
|
|
Language: |
|
English |
|
Format: |
|
HTML |
|
Legal depot: |
|
D/2012/10.273/ |
|
|
|
|
|
Copyright: |
|
KCE reports are published under a “by/nc/nd” Creative Commons Licence
|
|
|
|
|
|
|
|
|
|
How to refer to this document? |
|
<authors (name + first letter surname, comma between authors>. KCE PRocess Book. Brussels: Belgian Health Care Knowledge Centre (KCE). 2012. KCE Reports VOLC. D/2012/10.273/xx. |
|
|
|
|
PATIENT INVOLVEMENT IN POLICY RESEARCH AT KCE
You will find here the process note on 'how to involve patients in a research' as well as several animation techniques you can use with the patients or the stakeholders
| Attachment | Size |
|---|---|
| KCE_340_Proces Note_Patient_Involvement_Report2.pdf | 5.05 MB |
| KCE_340bis_Process_Note_animation_techniques.pdf | 1 MB |