GRADE SYSTEM (GCP, HTA)
1. Introduction
1.1. What is GRADE?
GRADE (Grading of Recommendations, Assessment, Development and Evaluation) offers a system for rating quality of evidence in systematic reviews and guidelines and grading strength of recommendations in guidelines. The system is designed for reviews and guidelines that examine alternative management strategies or interventions, which may include no intervention or current best management. It tries to offer a transparent and structured process for developing and presenting evidence summaries for systematic reviews and guidelines in health care and for carrying out the steps involved in developing recommendations.
The GRADE approach is based on a sequential assessment of the quality of evidence, followed by a judgment about the balance between desirable and undesirable effects, and subsequent decision about the strength of a recommendation. Separating the judgments regarding the quality of evidence from judgments about the strength of recommendations is a critical and defining feature of the GRADE system. Therefore, unlike many other grading systems, the GRADE system emphasizes that weak recommendations in the face of high quality evidence are common because of factors other than the quality of evidence influencing the strength of a recommendation, such as balance between desirable and undesirable effects, patient values and preferences and use of resources. For the same reason it allows for strong recommendations based on the evidence from observational studies.
Although the GRADE system makes judgments about quality of evidence and strength of recommendations in a systematic and transparent manner, it does not eliminate disagreements in interpreting evidence nor the inevitable need for judgments in deciding on the best among alternative courses of action. This is a very important aspect and the developers of GRADE repeatedly warn against a too mechanistic approach and stress the fact that different experts can use GRADE and come to different conclusions. What matters in the first place is to ensure a maximum transparency about judgments and to explicitly acknowledge the values and preferences that underlie the recommendation.
An introduction to GRADE is given based on the guidance provided by the help function of the GRADEpro [1] software and the series of articles that appeared in the Journal of Clinical Epidemiology. This series is not yet complete and additional articles will be published in the near future, going deeper into several aspects and problems that one may encounter when trying to implement GRADE. It is, however, important to realize that most problems that are encountered when applying GRADE are not in the first place due to GRADE itself, but are general dilemmas that a scientist is confronted with when trying to use scientific evidence supporting recommendations.
Mostly, the only thing GRADE does is to confront you systematically with these problems in a way that makes it difficult to simply ignore them, by forcing you to think about and make explicit judgments on these aspects and report the results of this effort, be it on issues of heterogeneity, precision, indirectness, valid end points or publication bias.
Therefore, GRADE should not be seen as a tool for standardization in the first place, but as a tool for quality assurance and transparency.
1.2. Limitations of GRADE
GRADE is used for systematic reviews, health technology assessments and clinical guidelines. The approach differs in principle somewhat for systematic reviews but this difference is not really relevant for KCE, as KCE does not in principle produces guidelines that do not go together with recommendations.
GRADE is not designed for the evaluations of public health interventions, and is not suitable not for Health System Research. Although some principles used in grade can be useful, there are too many unresolved questions. GRADE is in the first place designed for the evaluations of interventions, be such as drugs, surgical interventions or radiation therapy. Although GRADE also deals with diagnostics the approach is far from mature in this area and its usefulness is limited, we will explain the problems in more detail at the end of the document.
Recommendations that may be helpful but do not need grading are typically those in which it is sufficiently obvious that desirable effects outweigh undesirable effects that no direct evidence is available because no one would be foolish enough to conduct a study addressing the implicit clinical question. Typically, such recommendations are supported by a great deal of indirect evidence, but teasing out the nature of the indirect evidence would be challenging and a waste of time and energy. One way of recognizing such questions is that if one made the alternative explicit, it would be bizarre or laughable.
1.3. Steps in the process
GRADE includes the following steps:
- Ask a specific healthcare question to be answered by a recommendation;
- Identify all important outcomes for this healthcare question;
- Judge the relative importance of outcomes;
- Summarize all relevant evidence;
- Grade the quality of evidence for each outcome and for each comparison;
- Decide on the overall quality of evidence across outcomes;
- Include judgments about the underlying values and preferences related to the management options and outcomes;
- Decide on the balance of desirable and undesirable effects;
- Decide on the balance of net benefits and cost;
- Grade the strength of recommendation;
- Formulate a recommendation;
- Implement and evaluate.
The steps are visualized in the following flowchart:

2. Framing the question
GRADE requires a clear specification of the relevant setting, population, intervention, comparator(s), and outcomes (see Building a search question). A guideline question often involves an additional specification, i.e. the setting in which the guideline will be implemented. For instance, guidelines intended for resource-rich environments will often be inapplicable in resource-poor environments. Furthermore, in some cases it may be necessary to specify if the guideline needs to be implemented in an inpatient or an outpatient setting.
Questions must be sufficiently specific: across the range of populations, interventions, and outcomes, a more or less similar effect must be plausible. Because the relative risk associated with an intervention vs. a specific comparator is usually similar across a wide variety of baseline risks, it is usually appropriate for systematic reviews to generate single pooled estimates of relative effects across a wide range of patient subgroups. Recommendations, however, may differ across subgroups of patients at different baseline risk of an outcome, despite there being a single relative risk that applies to all of them. Absolute risk reductions are greater in higher-risk patients, warranting taking a higher risk of side effects and enduring inconvenience. Evidence quality may also differ across subgroups, and this may mandate differing recommendations (higher likelihood of recommending an intervention, or making a stronger recommendation when evidence is of higher quality). Thus, guideline panels must often define separate questions (and produce separate evidence summaries) for high- and low-risk patients, and patients in whom quality of evidence differs.
Example
The case for warfarin therapy associated with both inconvenience and a higher risk of serious bleeding is much stronger in atrial fibrillation patients at substantial vs. minimal risk of stroke.
3. Deciding on important outcomes
3.1. General approach
Outcomes may include survival (mortality), clinical events (e.g. stroke or myocardial infarction), patient-reported outcomes (e.g. specific symptoms, quality of life), adverse events, burdens (e.g. demands on caregivers, frequency of tests, restrictions on lifestyle) and economic outcomes (e.g. cost and resource use). It is critical to identify both outcomes related to adverse effects/harm as well as outcomes related to effectiveness.
Review authors should consider how outcomes should be measured, both in terms of the type of scale likely to be used and the timing of measurement. Outcomes may be measured objectively (e.g. blood pressure, number of strokes) or subjectively as rated by a clinician, patient or carer (e.g. disability scales). It may be important to specify whether measurement scales have been published or validated.
GRADE specifies three categories of outcomes according to their importance. Guideline developers must, and authors of systematic reviews are strongly encouraged to specify all potential patient-important outcomes as the first step in their endeavour. The guideline development group should classify outcomes as:
- Critical;
- Important, but not critical;
- Of limited importance.
The first two classes of outcomes will bear on guideline recommendations; the third may or may not. Ranking outcomes by their relative importance can help to focus attention on those outcomes that are considered most important, and help to resolve or clarify disagreements. GRADE recommends to focus on a maximum of 7 critical and/or important outcomes.
Guideline developers should first consider whether particular desirable or undesirable consequences of a therapy are important to the decision regarding the optimal management strategy, or whether they are of limited importance. If the guideline panel thinks that a particular outcome is important, then it should consider whether the outcome is critical to the decision, or only important, but not critical. To facilitate ranking of outcomes according to their importance guideline developers as well as authors of systematic reviews may choose to rate outcomes numerically on a 1 to 9 scale (7 to 9 – critical; 4 to 6 – important; 1 to 3 – of limited importance) to distinguish between importance categories.
For each recommendations GRADE proposes to limit the number of outcomes to a maximum of 7.

3.2. Perspective of outcomes
Different audiences are likely to have different perspectives on the importance of outcomes.
The importance of outcomes is likely to vary within and across cultures or when considered from the perspective of patients, clinicians or policy-makers. It is essential to take cultural diversity into account when deciding on relative importance of outcomes, particularly when developing recommendations for an international audience. Guideline panels should also decide what perspective they are taking. Guideline panels may also choose to take the perspective of the society as a whole (e.g. a guideline panel developing recommendations about pharmacological management of bacterial sinusitis may take the patient perspective when considering health outcomes, but also a society perspective when considering antimicrobial resistance to specific drugs).
3.3. Before and after literature review
For a guideline, an initial rating of the importance of outcomes should precede the review of the evidence, and this rating should be confirmed or revised following the evidence review.
One should aim to decide which outcomes are important during protocol development and before one undertakes a systematic review or guideline project.
However, rating importance of an outcome prior to evidence review is preliminary: when evidence becomes available a reassessment of importance is necessary.
Guideline panels should be aware that in some instances the importance of an outcome may only become known after the protocol is written, evidence is reviewed or the analyses are carried out, and should take appropriate actions to include these in the evidence tables.
Outcomes that are critical to decision making should be included in an evidence table whether or not information about them is available.
3.4. Implications of the classification
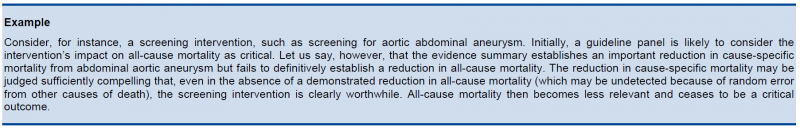
Only outcomes considered critical (rated 7—9) or important (rated 4—6) should be included in the evidence profile.
Only outcomes considered critical (rated 7—9) are the primary factors influencing a recommendation and should be used to determine the overall quality of evidence supporting this recommendation.
When determining which outcomes are critical, it is important to bear in mind that absence of evidence on a critical outcome automatically leads to a downgrading of the evidence.
3.5. Expert involvement
Experts and stakeholders should be involved when determining the research questions and important outcomes. At KCE this usually consists of inviting a number of experts in the field to an expert meeting. While interactions between experts often are useful, there is a real danger that unprepared meetings lead to ‘suboptimal’ decisions. The following may make this process easier:
- Try to make them focus on the really important questions, there are usually lots of interesting questions but scope needs to be limited
- Explain on forehand the implications of the term ‘critical outcome’. It is useful to ask the question on beforehand: is the outcome that critical that one is prepared to downgrade the level of evidence if insufficient evidence is found for this particular outcome.
- Make a proposal on beforehand, expert meetings are often too short to construct a complete framework of questions with the relevant outcomes from scratch by the invited experts.
- It may be useful to ask experts on beforehand to provide ratings for the different outcomes (e.g. in an Excel sheet) and ask them to put their justification in writing.
- Try to give an introduction on GRADE so that everybody has an understanding of what it is and what the implications are.
3.6. Use of surrogates
Guideline developers should consider surrogate outcomes only when high-quality evidence regarding important outcomes is lacking. When such evidence is lacking, guideline developers may be tempted to list the surrogates as their measures of outcome. This is not the approach GRADE recommends. Rather, they should specify the important outcomes and the associated surrogates they must use as substitutes. The necessity to substitute with the surrogate may ultimately lead to rating down the quality of the evidence because of indirectness.
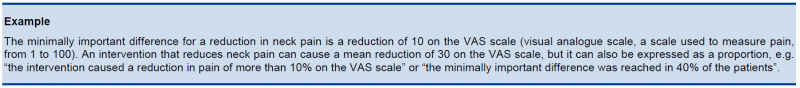
3.7. Clinical decision threshold and minimally important difference
When important decisions are made about outcomes, it is also important to consider the minimal clinical importance of an effect size, as this is best decided before the evidence is collected and summarized, in order to avoid subjective and ad hoc decisions influenced by the available evidence.
GRADE uses the term Clinical Decision Threshold, i.e. the threshold that would change the decision whether or not to adopt a clinical action.
For binary outcomes this usually implies a risk reduction. The threshold is likely to differ according to the outcome, e.g. a mortality reduction of 10 % will be more important than a reduction of 10% in the number of patients developing a rash. For continuous outcomes, the minimally important difference is used, i.e. the smallest difference in outcome of interest that informed patients or proxies perceive to be important, either beneficial or harmful, and that would lead the patient or clinician to consider a change in management.
Notes
- A minimally important difference is measured at the individual level.
- The effect on a continuous outcome can be expressed as a mean difference, but also as the proportion of patients having a benefit that is above the minimally important difference.
Determining this threshold is not straightforward and often difficult. Expert opinion is often essential.
For a few outcomes validated thresholds exist based on evidence from surveys amongst patients, e.g. the Cochrane back pain group determined a threshold for back and neck pain. Doing a specific literature search on this topic is probably too labour-intensive and moreover, there are no universally accepted and agreed validated methods for doing so. Some rules of thumb are provided by the GRADE working group, such as an increase/decrease of 25%, but one should be cautious to apply these without a critical reflection on the context.
3.8. Adverse effects
Any intervention may be associated with adverse effects that are not initially apparent. Thus, one might consider ‘‘as-yet-undiscovered toxicity’’ as an important adverse consequence of any new drug. Such toxicity becomes critical only when sufficient evidence of its existence emerges.
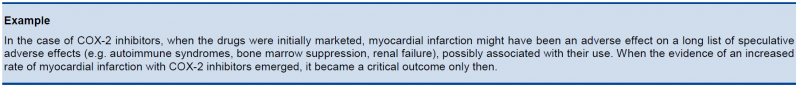
The tricky part of this judgment is how frequently the adverse event must occur and how plausible the association with the intervention must be before it becomes a critical outcome. For instance, an observational study found a previously unsuspected association between sulfonylurea use and cancer-related mortality. Should cancer deaths now be an important, or even a critical, endpoint when considering sulfonylurea use in patients with type 2 diabetes? As is repeatedly the case, we cannot offer hard and fast rules for these judgments.
4. Summarizing the evidence
Evidence must be summarized with results ideally coming from optimally conducted systematic reviews for each patient-important outcome. For each comparison of alternative management strategies, all outcomes should be presented together. It is likely that all studies relevant to a healthcare question will not provide evidence regarding every outcome. The GRADE working group has developed specific approaches to present the quality of the available evidence, the judgments that bear on the quality rating, and the effects of alternative management strategies on the outcomes of interest: the GRADE evidence profile (EP) and the Summary of Findings (SoF) table. An evidence profile is more detailed than a summary of findings table. The main difference is that it provides the detailed judgments and reasons for down- or upgrading per category (see below). As such, an evidence profile provides the information for other guideline developers and validators that allows them to understand how the judgment about the level of evidence was reached.
The GRADEpro software facilitates the process of developing both EPs and SoF tables.
The SoF table consists of 7 elements:
- A list of all important outcomes, both desirable and undesirable;
- A measure of the typical burden of these outcomes (e.g. control group, estimated risk);
- A measure of the risk in the intervention group or, alternatively or additionally, a measure of the difference between the risks with and without intervention;
- The relative magnitude of effect;
- Numbers of participants and studies addressing these outcomes;
- A rating of the overall confidence in effect estimates for each outcome (which may vary by outcome);
- Comments.
For binary outcomes, relative risks (RRs) are the preferred measure of relative effect and, in most instances, are applied to the baseline or control group risks to generate absolute risks. Ideally, the baseline risks come from observational studies including representative patients and identifying easily measured prognostic factors that define groups at differing risk. In the absence of such studies, relevant randomized trials provide estimates of baseline risk. When confidence intervals (CI) around the relative effect include no difference, one may simply state in the absolute risk column that results fail to show a difference, omit the point estimate and report only the CIs, or add a comment emphasizing the uncertainty associated with the point estimate.
On top of that GRADE provides a number of supplementary recommendations:
- A SoF table should present the seven (or fewer) most important outcomes. These outcomes must always be patient-important outcomes and never be surrogates, although surrogates can be used to estimate effects on patient-important outcomes;
- A SoF table should present the highest quality evidence;
- When quality of two bodies of evidence (e.g. randomized trials and observational studies) is similar, a SoF table may include summaries from both.
5. Rating the quality of evidence
5.1. Introduction
GRADE specifies four quality categories (high, moderate, low, and very low) that are applied to a body of evidence, but not to individual studies. In the context of a systematic review, quality reflects our confidence that the effect estimates are correct. In the context of recommendations, quality reflects our confidence that the effect estimates are adequate to support a particular recommendation.
Guideline panels have to determine the overall quality of evidence across all the critical outcomes essential to a recommendation they make. Guideline panels usually provide a single grade of quality of evidence for every recommendation, but the strength of a recommendation usually depends on evidence regarding not just one, but a number of patient-important outcomes and on the quality of evidence for each of these outcomes.
When determining the overall quality of evidence across outcomes:
- Consider only those outcomes that are deemed critical;
- If the quality of evidence differs across critical outcomes and outcomes point in different directions — towards benefit and towards harm — the lowest quality of evidence for any of the critical outcomes determines the overall quality of evidence;
- If all outcomes point in the same direction — towards either benefit or harm — the highest quality of evidence for a critical outcome, that by itself would suffice to recommend an intervention, determines the overall quality of evidence. However, if the balance of the benefits and harms is uncertain, the grade of the critical outcome with the lowest quality grading should be assigned.
5.1.1. Four levels of evidence
Randomized trials start as high-quality evidence, observational studies as low quality (see table). ‘‘Quality’’ as used in GRADE means more than risk of bias and may also be compromised by imprecision, inconsistency, indirectness of study results, and publication bias. In addition, several factors can increase our confidence in an estimate of effect. This general approach is summarized in the table below.


In the following chapters these factors will be discussed in depth. However, it is important to emphasize again that GRADE warns against applying this upgrading and downgrading in a too mechanistic way and to leave room for judgment.
Although GRADE suggests the initial separate consideration of five categories for rating down the quality of evidence and three categories for rating up, with a yes/no decision in each case, the final rating of overall evidence quality occurs in a continuum of confidence in the validity, precision, consistency, and applicability of the estimates. Fundamentally, the assessment of evidence quality remains a subjective process, and GRADE should not be seen as obviating the need for or minimizing the importance of judgment. As repeatedly stressed, the use of GRADE will not guarantee consistency in assessment, whether it is of the quality of evidence or of the strength of recommendation. There will be cases in which competent reviewers will have honest and legitimate disagreement about the interpretation of evidence. In such cases, the merit of GRADE is that it provides a framework that guides one through the critical components of this assessment and an approach to analysis and communication that encourages transparency and an explicit accounting of the judgments involved.
5.1.2. Overall quality of evidence
Guideline panels have to determine the overall quality of evidence across all the critical outcomes essential to a recommendation they make. Guideline panels usually provide a single grade of quality of evidence for every recommendation, but the strength of a recommendation usually depends on evidence regarding not just one, but a number of patient-important outcomes and on the quality of evidence for each of these outcomes.
When determining the overall quality of evidence across outcomes:
- Consider only those outcomes that are deemed critical;
- If the quality of evidence differs across critical outcomes and outcomes point in different directions — towards benefit and towards harm — the lowest quality of evidence for any of the critical outcomes determines the overall quality of evidence;
- All outcomes point in the same direction — towards either benefit or harm — the highest quality of evidence for a critical outcome that by itself would suffice to recommend an intervention determines the overall quality of evidence. However, if the balance of the benefits and downsides is uncertain, then the grade of the critical outcome with the lowest quality grading should be assigned.
5.1.3. GRADE and meta-analysis
GRADE relies on the judgment about our confidence in a (beneficial or adverse) effect of an intervention and therefore it is impossible to apply GRADE correctly if a meta-analysis is not at least considered and the necessary judgments are made on (statistical, methodological and clinical) heterogeneity. It is possible that no pooled effect can or should be calculated if there is evidence of heterogeneity, be it clinical, methodological or merely statistical, but meta-analysis should always be attempted. Otherwise, it is impossible to gather sufficient elements to make the necessary GRADE judgments. Note that heterogeneity is in most cases a reason to downgrade the body of evidence, with some exceptions that will be explained later.
In order to apply GRADE (but actually in order to make a sound judgment on evidence in general) it is essential that at least one person implicated in the development of the guideline understands this guidance and is able to apply it.
GRADE remains rather vague about what to do if only one study is available. We recommend to downgrade the evidence with at least one level, except when the single study is a multicentre study where sample size in the individual centres is sufficient to demonstrate heterogeneity if there is any. Any decision not to downgrade must be explained and justified.
If the primary studies do not allow the calculation of a confidence interval, consider downgrading as judging precision and heterogeneitiy becomes difficult. There are some rare exceptions, when the confidence interval is not needed as all studies point clearly in the same direction. In some cases non-parametric tests are used because the assumption of normality is violated. In these case, the non-parametric measure of uncertainty should be used (most of the time an interquartile range) and interpreted. Decisions taken around these issues should be justified.
5.2. Study limitations, risk of bias
5.2.1. Risk of bias assessment of individual studies should be done using a validated assessment tool
For the quality assessment of individual studies, specific tools were selected by the KCE.
There is no agreed KCE tool for observational studies. At this moment, we limit ourselves to a number of elements that need to be verified when looking at observational studies. There are a large number of assessment tools, but in the scientific community there is considerable disagreement on what items really matter. Moreover, observational studies are way more diverse then RCTs.
Study limitations in observational studies as identified by GRADE are:
- Failure to develop and apply appropriate eligibility criteria (inclusion of control population);
- Under- or overmatching in case-control studies;
- Selection of exposed and unexposed in cohort studies from different populations;
- Flawed measurement of both exposure and outcome;
- Differences in measurement of exposure (e.g., recall bias in case-control studies);
- Differential surveillance for outcome in exposed and unexposed in cohort studies;
- Failure to adequately control confounding;
- Failure of accurate measurement of all known prognostic factors;
- Failure to match for prognostic factors and/or lack of adjustment in statistical analysis;
- Incomplete follow-up.
5.2.2. Moving from individual risk of bias to a judgment about rating down for risk of bias across a body of evidence
Moving from risk of bias criteria for each individual study to a judgment about rating down for risk of bias across a group of studies addressing a particular outcome presents challenges. GRADE suggests the following principles:
- First, in deciding on the overall quality of evidence, one does not average across studies (for instance if some studies have no serious limitations, some serious limitations, and some very serious limitations, one does not automatically rate quality down by one level because of an average rating of serious limitations). Rather, judicious consideration of the contribution of each study, with a general guide to focus on the high-quality studies, is warranted.
- Second, this judicious consideration requires evaluating the extent to which each trial contributes toward the estimate of magnitude of effect. This contribution will usually reflect study sample size and number of outcome events: larger trials with many events will contribute more, much larger trials with many more events will contribute much more.
- Third, one should be conservative in the judgment of rating down. That is, one should be confident that there is substantial risk of bias across most of the body of available evidence before one rates down for risk of bias.
- Fourth, the risk of bias should be considered in the context of other limitations. If, for instance, reviewers find themselves in a close-call situation with respect to two quality issues (risk of bias and, e.g. precision), we suggest rating down for at least one of the two.
- Fifth, notwithstanding the first four principles, reviewers will face close-call situations. They should both acknowledge that they are in such a situation, make it explicit why they think this is the case, and make the reasons for their ultimate judgment apparent.
This approach is summarized in the table below.

5.3. Inconsistency
Widely differing estimates of the treatment effect (i.e. heterogeneity or variability in results) across studies suggest true differences in underlying treatment effect. When heterogeneity exists, but investigators fail to identify a plausible explanation, the quality of evidence should be downgraded by one or two levels, depending on the magnitude of the inconsistency in the results.
Inconsistency may arise from differences in:
- Populations (e.g. drugs may have larger relative effects in sicker populations);
- Interventions (e.g. larger effects with higher drug doses);
- Outcomes (e.g. diminishing treatment effect with time).
Guideline panels or authors of systematic reviews should also consider the extent to which they are uncertain about the underlying effect due to the inconsistency in results and they may downgrade the quality rating by one or even two levels.
GRADE suggests rating down the quality of evidence if large inconsistency (heterogeneity) in study results remains after exploration of a priori hypotheses that might explain heterogeneity.
5.3.1. Heterogeneity and inconsistency
GRADE uses inconsistency and heterogeneity rather interchangeably. However, there are some important nuances:
- A heterogeneity in effect – where it can be assumed that it is randomly distributed – may be due to random variation in the effect amongst studies. To properly address this, the pooled effect should be calculated using random modelling (RevMan uses the DerSimonian and Laird random effects model, but other techniques, such as Bayesian and maximum likelihood, are often used as well). An important condition for the use of these techniques is that it must be plausible that the heterogeneous effect is randomly distributed, which is not always easy to verify. DerSimonian, Laird and maximum likelihood methods have an additional assumption that the effect is normally distributed, while with Bayesian techniques another distribution can be used as well. The studies in this case cannot be considered as inconsistent, and the heterogeneity is accounted for here by the larger confidence interval, so no downgrading is needed here. Note that if the heterogeneity statistic Q is less than or equal to its degrees of freedom (so if I² = 0), DerSimonian gives results that are numerically identical to the (non random effects) inverse variance method.
- If heterogeneity is important for one reason or another, but all estimates point in the same direction, e.g. a strong or very strong effect of the intervention, then one should not necessary downgrade for inconsistency but make a judgement on the plausibility of the study results.
5.3.2. Judging heterogeneity and inconsistency
Exploring and judging heterogeneity is probably the most difficult part in performing and judging a meta-analysis. A number of rules are presented, but a full explanation can be found in the Cochrane Handbook (chapters 9.5 and 9.6). A KCE expert exploring and judging heterogeneity should at least have a good understanding of and ability to apply this Cochrane guidance. If not, he/she should ask for help from somebody who does.
GRADE identifies four criteria for assessing inconsistency in results, and reviewers should consider rating down for inconsistency when:
- Point estimates vary widely across studies;
- Confidence intervals (CIs) show minimal or no overlap;
- The statistical test for heterogeneity which tests the null hypothesis that all studies in a meta-analysis have the same underlying magnitude of effect shows a low p-value;
- The I², which quantifies the proportion of the variation in point estimates due to between-study differences, is large
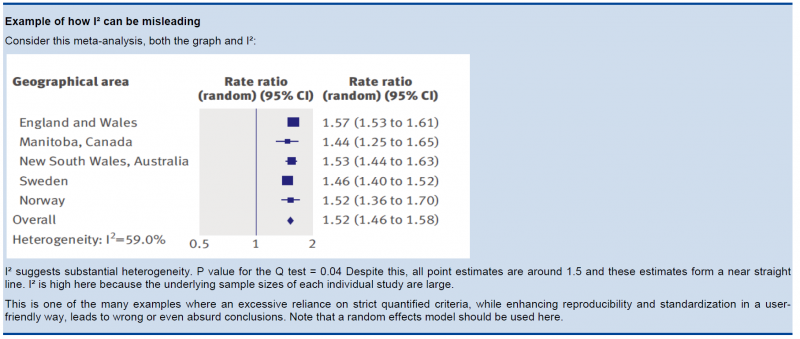
In the past, rigid criteria were used to judge heterogeneity, e.g. an I² of 50% used to be a common threshold. This improves the consistency in judgments, but one risks to be consistently wrong. All statistical approaches have their limitations, and their results should be seen in the context of a subjective examination of the variability in point estimates and the overlap in CIs. So again, transparent judgments are essential here.
What is a large I²? One set of criteria would say that an I² of less than 40% is low, 30 to 60% may be moderate, 50 to 90% may be substantial, and 75 to 100% is considerable. Note the overlapping ranges and the equivocation (‘‘may be’’): an implicit acknowledgment that the thresholds are both arbitrary and uncertain. When individual study sample sizes are small, point estimates may vary substantially, but because variation may be explained by chance, I² may be low. Conversely, when study sample size is large, a relatively small difference in point estimates can yield a large I².
5.3.3. Other considerations
- Risk differences (i.e. absolute risk reductions) in subpopulations tend to vary widely. Relative risk (RR) reductions, on the other hand, tend to be similar across subgroups, even if subgroups have substantial differences in baseline risk. GRADE considers the issue of difference in absolute effect in subgroups of patients, much more common than differences in relative effect, as a separate issue. When easily identifiable patient characteristics confidently permit classifying patients into subpopulations at appreciably different risk, absolute differences in outcome between intervention and control groups will differ substantially between these subpopulations. This may well warrant differences in recommendations across subpopulations.
- Rate down for inconsistency, not up for consistency.
- Even when there is heterogeneity in effect, one must evaluate if the heterogeneity affects your judgment on clinical effectiveness, e.g. when there are large differences in the effect size, but when the estimations point to the same direction (all beneficial or all harmful).
- Reviewers should combine results only if – across the range of patients, interventions, and outcomes considered – it is plausible that the underlying magnitude of treatment effect is similar. This decision is a matter of judgment. Magnitude of intervention effects may differ across studies, due to the population (e.g. disease severity), the interventions (e.g. doses, co-interventions, comparison of interventions), the outcomes (e.g. duration of follow-up), or the study methods (e.g. randomized trials with higher and lower risk of bias). If one of the first three categories provides the explanation, review authors should offer different estimates across patient groups, interventions, or outcomes. Guideline panelists are then likely to offer different recommendations for different patient groups and interventions. If study methods provide a compelling explanation for differences in results between studies, then authors should consider focusing on effect estimates from studies with a lower risk of bias.
Beware of subgroup analyses. The warning below originates from the Cochrane Handbook (chapter 9.6). When confronted with this, consult at least a second opinion of a knowledgeable person.
Subgroup analyses involve splitting all the participant data into subgroups, often so as to make comparisons between them. Subgroup analyses may be done for subsets of participants (such as males and females), or for subsets of studies (such as different geographical locations). Subgroup analyses may be done as a means of investigating heterogeneous results, or to answer specific questions about particular patient groups, types of intervention or types of study. Findings from multiple subgroup analyses may be misleading. Subgroup analyses are observational by nature and are not based on randomized comparisons (an exception is when randomisation is stratified within these subgroups). False negative and false positive significance tests increase in likelihood rapidly as more subgroup analyses are performed (this is due to the multiple testing problem: if you perform a significant test frequently enough, you are likely to find by chance a statistically significant result). If findings are presented as definitive conclusions, there is clearly a risk of patients being denied an effective intervention or treated with an ineffective (or even harmful) intervention. Subgroup analyses can also generate misleading recommendations about directions for future research that, if followed, would waste scarce resources.
5.4. Indirectness
Direct evidence comes from research that directly compares the interventions in which we are interested when applied to the populations in which we are interested and measures outcomes important to patients. Evidence can be indirect in one of four ways:
- First, patients may differ from those of interest (the term applicability is often used for this form of indirectness).
- Secondly, the intervention tested may differ from the intervention of interest. Decisions regarding indirectness of patients and interventions depend on an understanding of whether biological or social factors are sufficiently different that one might expect substantial differences in the magnitude of effect.
- Thirdly, outcomes may differ from those of primary interest, for instance, surrogate outcomes that are not themselves important, but measured in the presumption that changes in the surrogate reflect changes in an outcome important to patients.
- A fourth type of indirectness, conceptually different from the first three, occurs when clinicians must choose between interventions that have not been tested in head-to-head comparisons. Making comparisons between treatments under these circumstances requires specific statistical methods and will be rated down in quality one or two levels depending on the extent of differences between the patient populations, co-interventions, measurements of the outcome, and the methods of the trials of the candidate interventions.
5.5. Imprecision
GRADE suggests that examination of 95% confidence intervals (CIs) provides the optimal primary approach to decisions regarding imprecision. Results are considered imprecise when studies include relatively few patients and few events and thus have wide confidence intervals around the estimate of the effect. In this case a guideline panel will judge the quality of the evidence lower than it otherwise would because of resulting uncertainty in the results.
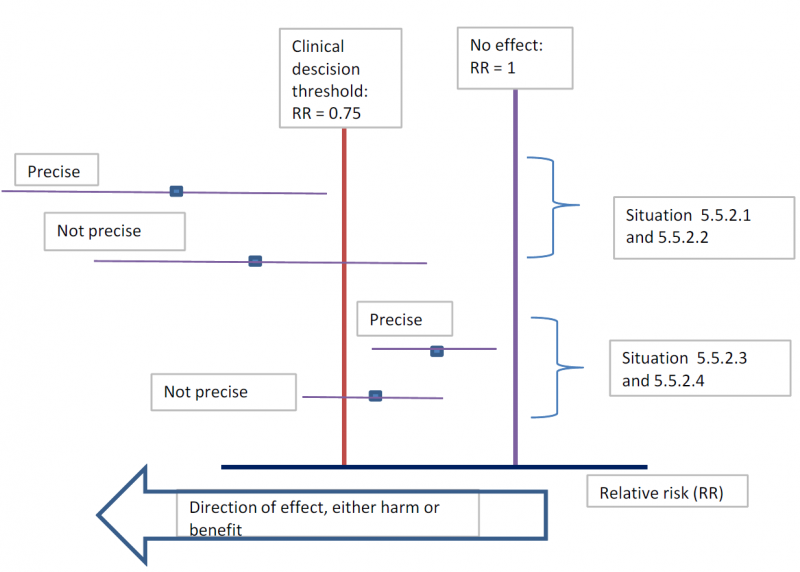
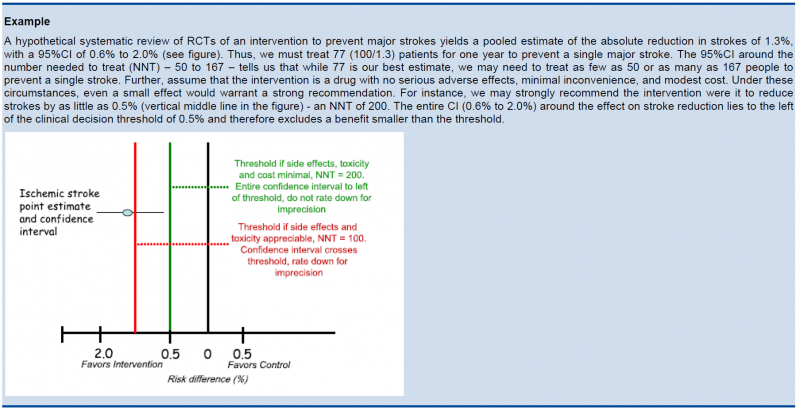
As a general principle GRADE recommends to consider the rating down for imprecision If a recommendation or clinical course of action would differ if the upper versus the lower boundary of the CI represented the truth. In order to judge this the clinical decision threshold needs to be defined. We explain the situation for both categorical and continuous outcomes.
5.5.1. Clinical decision threshold and minimally important difference
5.5.1.1. Categorical outcomes
As we explained before, it is good to discuss the clinical decision threshold and try to determine them on beforehand. However, one must be careful not to apply this in a too mechanical way, as you need also to take into account the downsides of the intervention, such as side effect or morbidity induced by the intervention, on which in a lot of cases you have only information after collecting the evidence. If it is not possible to determine a threshold, then GRADE suggests to use a RRR or RRI greater than 25%. This 25% threshold is a good and pragmatic starting point, but other factors should be taken into account as well, such as the absolute risk reduction.
5.5.1.2. Continuous outcomes
If the 95%CI upper or lower CI crosses the minimally important difference (MID), either for benefit of harm.
Note: if the MID is not known or the use of different outcome measures required calculation of an effect size, we suggest downgrading if the upper or lower CI crosses an effect size of 0.5 in either direction.
Effect size (ES):
A generic term for the estimate of effect of treatment for a study. Sometimes, the term is used to refer to the standardized mean difference, the difference between two estimated means divided by an estimate of the standard deviation.
To facilitate the understanding we suggest an interpretation of the effect size offered by Cohen, also known as ‘Cohen’s d’[1]. According to this interpretation, an effect size or SMD of around:
- 0.2 is considered a small effect;
- 0.5 is considered a moderate effect;
- 0.8 or higher is considered a large effect.
There are also other methods to standardise effect sizes, such as Glass ∆ or hedges d, depending on the choice of the estimator of the standard deviation.
[1] (Cohen J. Statistical Power Analysis for the Behavioral Sciences. 2nd ed; 1988).
5.5.2. Application and examples
The concrete application of these rules differs according to the situation. Note that imprecision is judged on all outcomes that are judged critical, so the precision of the estimations of the effects on both harms and benefits need to be evaluated.
- Studies indicate a benefit compared to the alternative so you consider recommending the intervention based on the fact that it is beneficial in a clinically significant way.
In this case you must prove not only that the pooled or best estimate of the effect is different from no effect but that it is better than the clinical decision threshold. So the confidence interval must exclude this threshold.
- Studies indicate a harm compared to the alternative so you consider not recommending the intervention based on the fact that it is harmful in a clinically significant way.
In this case you must prove not only that the pooled or best estimate of the effect is different from no effect but that it is more harmful then the clinical decision threshold. So the confidence interval must exclude this threshold.
- Studies indicate that it is not better than the alternative so you consider not recommending the intervention based on the fact that it is not better in a clinically significant way.
In this case you must prove that the pooled or best estimate of the effect is lower that the clinical decision threshold. So the confidence interval must exclude this threshold.
- Studies indicate that it is not more harmful than the alternative so you consider recommending the intervention based on the fact that it is not more harmful in a clinically significant way.
In this case you must prove that the pooled or best estimate of the effect is lower that the clinical decision threshold. So the confidence interval must exclude this threshold.
The last two situations amount to proving non superiority or non inferiority. If the line of no effect is crossed, this does not play a major role in the decision.
5.5.3. Relative versus absolute reductions
The recommended output of a meta-analysis is a relative risk or odds ratio as they are more stable across different baseline risks, but absolute reductions are more useful for clinical decisions. The valid way of estimating the absolute risk reduction is to multiply the relative risk from the meta-analysis with the most plausible estimate or range of estimates of the baseline risk, this is the risk in the assumed control group, often called the assumed control risk.
Assumed control risk (ACR):
As relative risks are more stable, absolute risk reductions are best calculated applying a relative risk reduction to an assumed control risk. Determining the assumed control risk is not always easy and straightforward. The best estimates usually come from Belgian data, e.g. for cancer the data from the cancer registry are a valuable tool. When not available one can use expert opinion or take the baseline effect from studies in the literature. When different studies exist with varying baseline risk sometimes the median control risk is taken (this is what GRADE pro does by default), but it may be better to report a range of plausible values.
5.5.4. Dealing with fragility: Optimal Information Size (OIS)
The clinical decision threshold criterion is not completely sufficient to deal with issues of precision. The reason is that confidence intervals may appear narrow, but small numbers of events may render the results fragile.
The reasoning above suggests the need for, in addition to CIs, another criterion for adequate precision. GRADE suggests the following: if the total number of patients included in a systematic review is less than the number of patients generated by a conventional sample size calculation for a single adequately powered trial, consider the rating down for imprecision. Authors have referred to this threshold as the “optimal information size” (OIS). Many online calculators for sample size calculation are available, you can find one simple one at http://www.stat.ubc.ca/∼rollin/stats/ssize/b2.html.
As an alternative to calculating the OIS, review and guideline authors can also consult a figure to determine the OIS. The figure presents the required sample size (assuming α of 0.05, and β of 0.2) for RRR of 20%, 25%, and 30% across varying control event rates. For example, if the best estimate of control event rate was 0.2 and one specifies an RRR of 25%, the OIS is approximately 2 000 patients.
The choice of RRR is a matter of judgment. The GRADE handbook suggested using RRRs of 20% to 30% for calculating the OIS, but there may be instances in which compelling prior information would suggest choosing a larger value for the RRR for the OIS calculation.
Beware, however, not to base your sample size on the RRR of minimally clinical importance, a practice that is suitable for sample size calculations when you set up studies, but not for judging fragility, because it leads to paradoxes: if expected effects are considerably larger than what is clinically important because the clinically important effect is small (e.g. a small effect on mortality in children would be considered important), you would risk to downgrade without good reasons because the required sample size would be too large. Note that the OIS helps judging the stability of the CIs, and not if the study was large enough to detect a difference.

Power is, however, more closely related to number of events than to sample size. The figure presents the same relationships using total number of events across all studies in both treatment and control groups instead of total number of patients. Using the same choices as in the prior paragraph (control event rate 0.2 and RRR 25%), one requires approximately 325 events to meet OIS criteria.

Calculating the OIS for continuous variables requires specifying:
- probability of detecting a false effect – type I error (α; usually 0.05)
- probability of detecting a true effect – power (usually 80% [power = 1 – type II error; β; usually 0.20])
- realistic difference in means (Δ)
- appropriate standard deviation (SD) from one of the relevant studies (we suggest the median of the available trials or the rate from a dominating trial, if it exists).
For continuous variables we should downgrade when total population size is less than 400 (a threshold rule-of-thumb value; using the usual α and β, and an effect size of 0.2 SD, representing a small effect). In general an number of events of more then 400 guarantees the stability of a confidence interval.
5.5.5. Low event rates with large sample size: an exception to the need for OIS
In the criteria we have offered so far, our focus has been on relative effects. When event rates are very low, CIs around relative effects may be wide, but if sample sizes are sufficiently large, it is likely that prognostic balance has indeed been achieved, and rating down for imprecision becomes inappropriate. 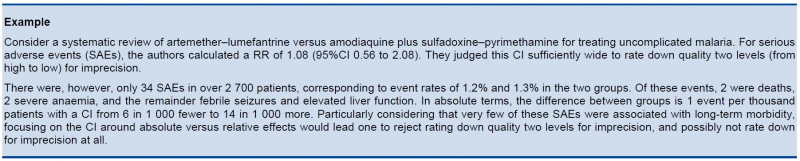
The decision regarding the magnitude of effect that would be important is a matter of judgment. When control rates are sufficiently low, CIs around relative effects can appear very wide, but CIs around absolute effects will nevertheless be narrow. Thus, although one would intuitively rate down for imprecision considering only the CI around the relative effect, consideration of the CI around the absolute effect may lead to an appropriate conclusion that precision is adequate. Note that the inference of unimportance requires a low incidence of events over the desirable duration of follow-up; short follow-up will generate a low incidence of events that may be misleading.
5.6. Publication bias
Publication bias is a systematic underestimate or an overestimate of the underlying beneficial or harmful effect due to the selective publication of studies. Publication bias arises when investigators fail to report studies they have undertaken (typically those that show no effect). Authors should suspect publication bias when available evidence comes from a number of small studies, most of which have been commercially funded.
A number of approaches based on the examination of the pattern of data are available to help assess publication bias. The most popular of these is the funnel plot. All, however, have substantial limitations and authors of reviews and guideline panels must often guess about the likelihood of publication bias. Again, there is no substitute for judgment.
Note that selective reporting of outcomes should be dealt with in the assessment of the individual studies.
Guideline panels or authors of systematic reviews should consider the extent to which they are uncertain about the magnitude of the effect due to selective publication of studies and they may downgrade the quality of evidence by one or even two levels. As there are no validated decision rules to do so it is important to provide a narrative justification of the final decision on this issue after consultation of the experts.
Trials registries are in principle compulsory now and can play a major role in detecting selective reporting.
5.7. Reasons to upgrade studies
Observational studies are by default considered low level of evidence. However, the level of evidence can be upgraded for a number of reasons. an important general remark on this issue: only studies with no threats to validity (not downgraded for any reason) can be upgraded. RCT evidence can in principle be upgraded, but GRADE considers this as rare and exceptional.
5.7.1. Large magnitude of effect
When methodologically strong observational studies yield large or very large and consistent estimates of the magnitude of a treatment or exposure effect, we may be confident about the results. In these situations, the weak study design is unlikely to explain all of the apparent benefit or harm, even though observational studies are likely to provide an overestimate of the true effect.
The larger the magnitude of effect, the stronger becomes the evidence. As a rule of thumb, the following criteria were proposed by GRADE:
- Large, i.e. RR >2 or <0.5 (based on consistent evidence from at least 2 studies, with no plausible confounders): upgrade 1 level
- Very large, i.e. RR >5 or <0.2 (based on direct evidence with no major threats to validity): upgrade 2 levels
5.7.2. All plausible confounders
On occasion, all plausible confounding from observational studies or randomized trials may be working to reduce the demonstrated effect or increase the effect if no effect was observed.
For example, if only sicker patients receive an experimental intervention or exposure, yet they still fare better, it is likely that the actual intervention or exposure effect in less sick patients is larger than the data suggest.
5.7.3. Dose-response gradient
The presence of a dose-response gradient may increase our confidence in the findings of observational studies and thereby increase the quality of evidence.
6. Recommendations
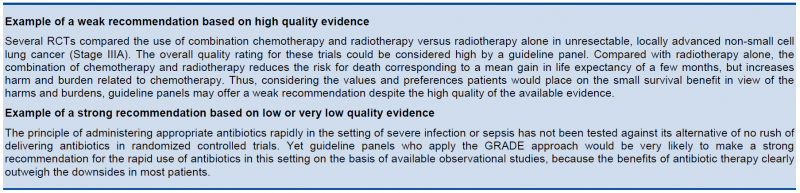
The strength of a recommendation reflects the extent to which a guideline panel is confident that desirable effects of an intervention outweigh undesirable effects, or vice versa, across the range of patients for whom the recommendation is intended. GRADE specifies only two categories of the strength of a recommendation. While GRADE suggests using the terms strong and weak recommendations, those making recommendations may choose different wording to characterize the two categories of strength.
For a guideline panel or others making recommendations to offer a strong recommendation, they have to be certain about the various factors that influence the strength of a recommendation. The panel also should have the relevant information at hand that supports a clear balance towards either the desirable effects of an intervention (to recommend an action) or undesirable effects (to recommend against an action). A strong recommendation is one for which the guideline panel is confident that the desirable effects of an intervention outweigh its undesirable effects (strong recommendation for an intervention) or that the undesirable effects of an intervention outweigh its desirable effects (strong recommendation against an intervention). A strong recommendation implies, that most or all individuals will be best served by the recommended course of action.
When a guideline panel is uncertain whether the balance is clear or when the relevant information about the various factors that influence the strength of a recommendation is not available, a guideline panel should be more cautious and in most instances it would opt to make a weak recommendation. A weak recommendation is one for which the desirable effects probably outweigh the undesirable effects (weak recommendation for an intervention) or undesirable effects probably outweigh the desirable effects (weak recommendation against an intervention) but appreciable uncertainty exists. A weak recommendation implies, that not all individuals will be best served by the recommended course of action. There is a need to consider more carefully than usual individual patient’s circumstances, preferences, and values.
6.1. Four key factors influence the strength of a recommendation
- Balance between desirable and undesirable effects (not considering costs)
The larger the difference between the desirable and undesirable consequences, the more likely a strong recommendation is warranted. The smaller the net benefit and the lower the certainty for that benefit, the more likely a weak recommendation is warranted.
- Quality of the evidence
The higher the quality of evidence, the more likely is a strong recommendation.
- Values and preferences
The greater the variability in values and preferences, or uncertainty in values and preferences, the more likely a weak recommendation is warranted.
- Costs (resource utilization)
The higher the costs of an intervention – that is, the more resources are consumed – the less likely a strong recommendation is warranted.
6.2. Wording of a recommendation
Wording of a recommendation should offer clinicians as many indicators as possible for understanding and interpreting the strength of recommendations:
- For strong recommendations, the GRADE working group has suggested adopting terminology, such as "we recommend..." or "clinicians should...".
- For weak recommendations, the GRADE working group has suggested less definitive wording, such as "we suggest..." or "clinicians might...".
Whatever terminology guideline panels use to communicate the dichotomous nature of a recommendation, it is essential that they inform their users what the terms imply. Guideline panels should describe patients or populations (characterized by the disease and other identifying factors) for whom the recommendation is intended and a recommended intervention as specifically and detailed as possible.
Wording strong and weak recommendations is particularly important when guidelines are developed by international organizations and/or are intended for patients and clinicians in different regions, cultures, traditions, and usage of language. It is also crucial to explicitly and precisely consider wording when translating recommendations into different languages.
It is important to adapt the wording of the recommendation to the available evidence. Absence of a statistically significant effect is no proof that an intervention does not work. It is only proven that an intervention doesn’t work if the confidence interval around the effect estimation excludes a minimally important difference or decision threshold.
7. GRADE and diagnostic testing
The GRADE system can be used to grade the quality of evidence and strength of recommendations for diagnostic tests or strategies. There are still a number of limitations and problems that are not entirely solved yet. However, there are some informative publications coming from the GRADE working group on this topic to guide authors of systematic reviews and guideline developers using GRADE to assess the quality of a body of evidence from diagnostic test accuracy (DTA) studies (Schünemann 2008, Brozek 2009, Hsu 2011, Schünemann 2016). People from the GRADE working group continue to publish on GRADE for diagnostic testing, see for example Journal of Clinical Epidemiology Volume 92 (December 2017) .
| Attachment | Size |
|---|---|
| GRADE_for_Diagnosis_KCE_guidance_final2_20171220.pdf | 742.06 KB |